Open Access
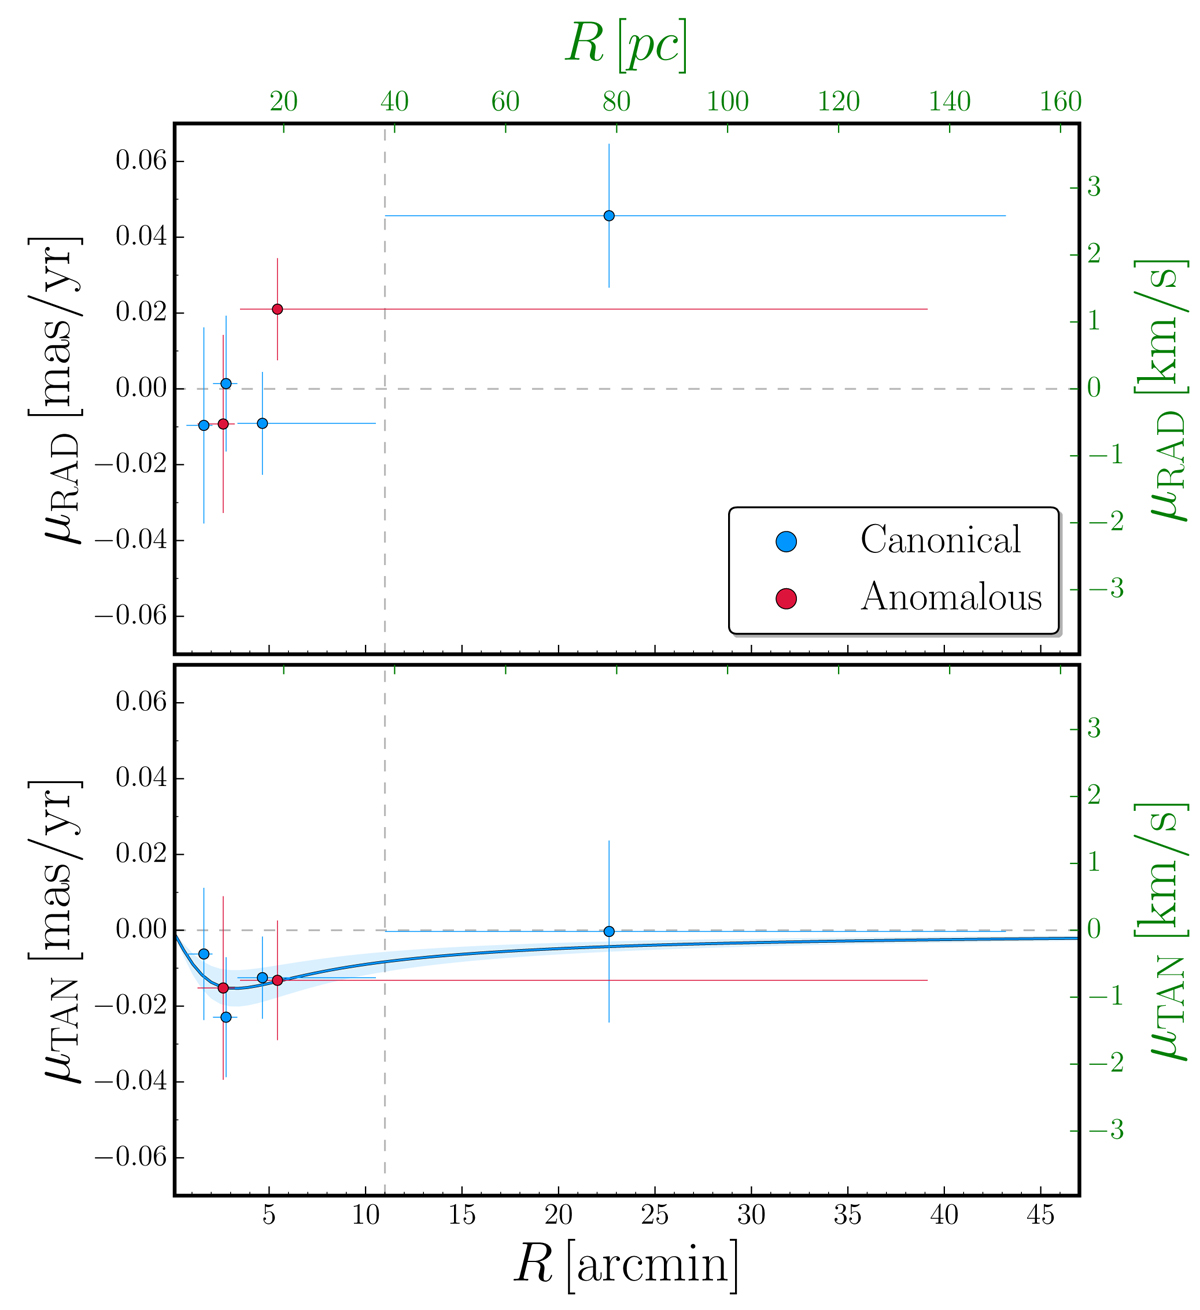
Fig. 6.
Download original image
Mean motion of multiple stellar populations. Mean motion along the radial (top panel) and tangential (bottom panel) direction. Azure and red points indicate canonical and anomalous dynamical profile. Physical units (i.e., parsec and km s−1) are displayed in the top and right axis in green.
Current usage metrics show cumulative count of Article Views (full-text article views including HTML views, PDF and ePub downloads, according to the available data) and Abstracts Views on Vision4Press platform.
Data correspond to usage on the plateform after 2015. The current usage metrics is available 48-96 hours after online publication and is updated daily on week days.
Initial download of the metrics may take a while.