Fig. 5.
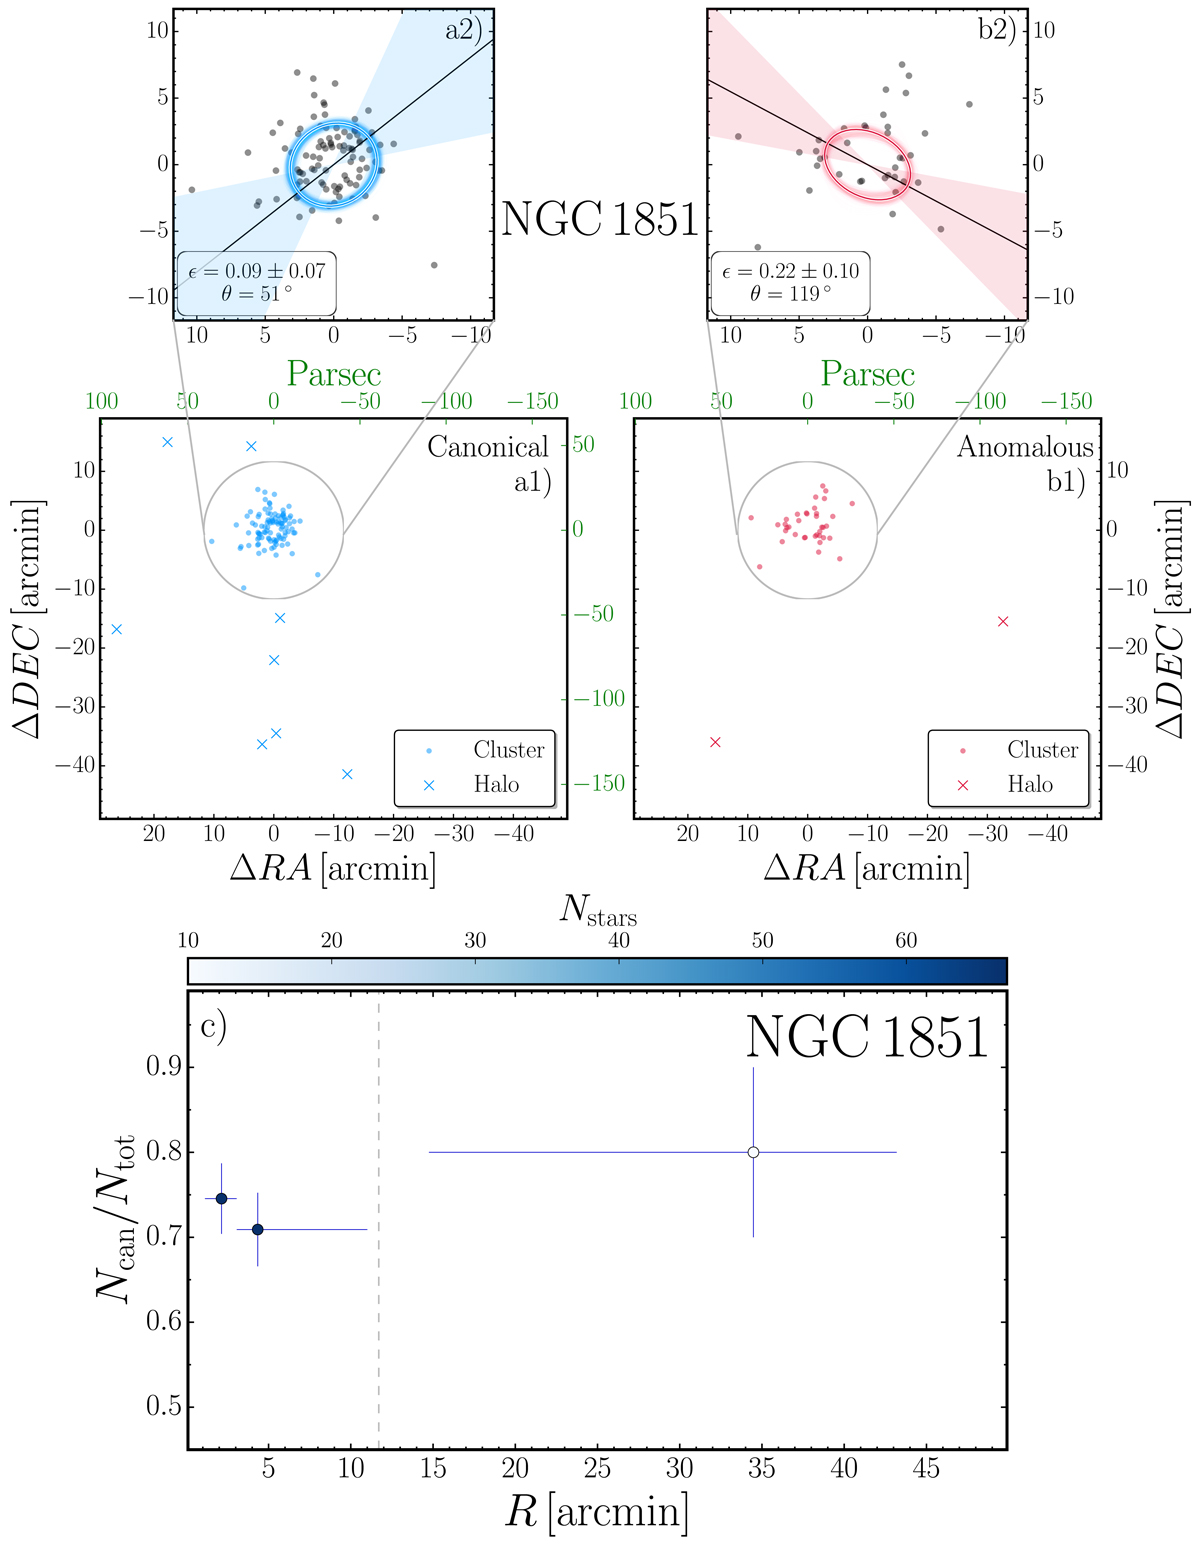
Download original image
Morphology of multiple stellar populations. Panels a1–b1: spatial distribution of canonical and anomalous stars, shown respectively in azure and red colors. Stars within the tidal radius are marked as filled dots, while extra-tidal stars are represented with crosses. The 11.7 arcmin tidal radius is indicated by the gray circles. Physical units, namely, parsecs, are displayed on the top and right axis in green. Panels a2–b2: zoom of the cluster field, with the best-fit ellipses shown as solid thick azure and red lines, and the position angle indicated by the solid black lines. Uncertainties are represented by the shaded regions. Panel c: radial distributions of canonical stars. The color is representative of the number of stars contained within each bin, while the gray dashed line indicates the tidal radius.
Current usage metrics show cumulative count of Article Views (full-text article views including HTML views, PDF and ePub downloads, according to the available data) and Abstracts Views on Vision4Press platform.
Data correspond to usage on the plateform after 2015. The current usage metrics is available 48-96 hours after online publication and is updated daily on week days.
Initial download of the metrics may take a while.