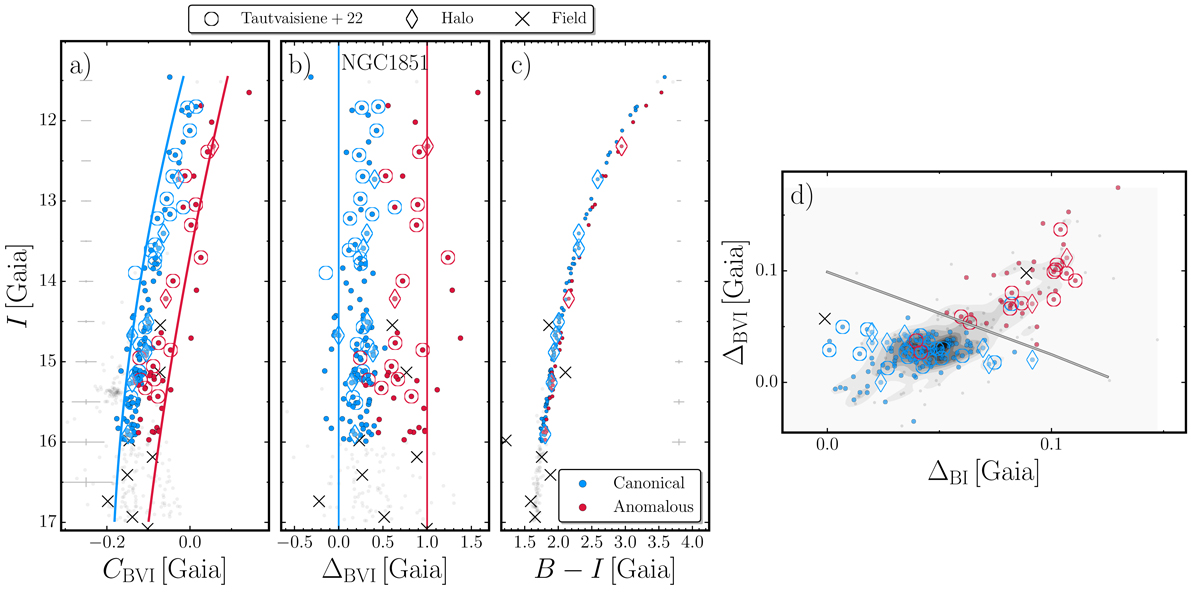
Fig. 3.
Download original image
Multiple stellar populations along the CMD. Panel a: I vs. CBVI pseudo-color diagram of NGC 1851 cluster members. Canonical and anomalous stars, selected in the Chm displayed in panel d, are respectively marked with filled azure and red dots. Empty diamonds indicate halo stars, i.e. stars outside the 11.7 arcmin tidal radius. Azure and red empty circles indicate metal-poor and metal-rich stars identified in Tautvaišienė et al. (2022), respectively. Average photometric uncertainties are shown as gray errorbars in panels a–c. Panel b: verticalized I vs. ΔBVI pseudo-color diagram color-coded as in panel a. Panel c: I vs. B − I CMD. Panel d: ΔBVI vs. ΔBI ChM. Stars are color-coded as in panel a. The gray line represents the line used to separate canonical and anomalous stars. Gray contours in the background represent the star density distribution as determined by means of 2D Gaussian KDE with fixed bandwidth. In the whole field of view, we identified 108 and 39 candidate canonical and anomalous stars, respectively, while outside the tidal radius we found eight and two canonical and anomalous stars, respectively.
Current usage metrics show cumulative count of Article Views (full-text article views including HTML views, PDF and ePub downloads, according to the available data) and Abstracts Views on Vision4Press platform.
Data correspond to usage on the plateform after 2015. The current usage metrics is available 48-96 hours after online publication and is updated daily on week days.
Initial download of the metrics may take a while.