Fig. 3.
Download original image
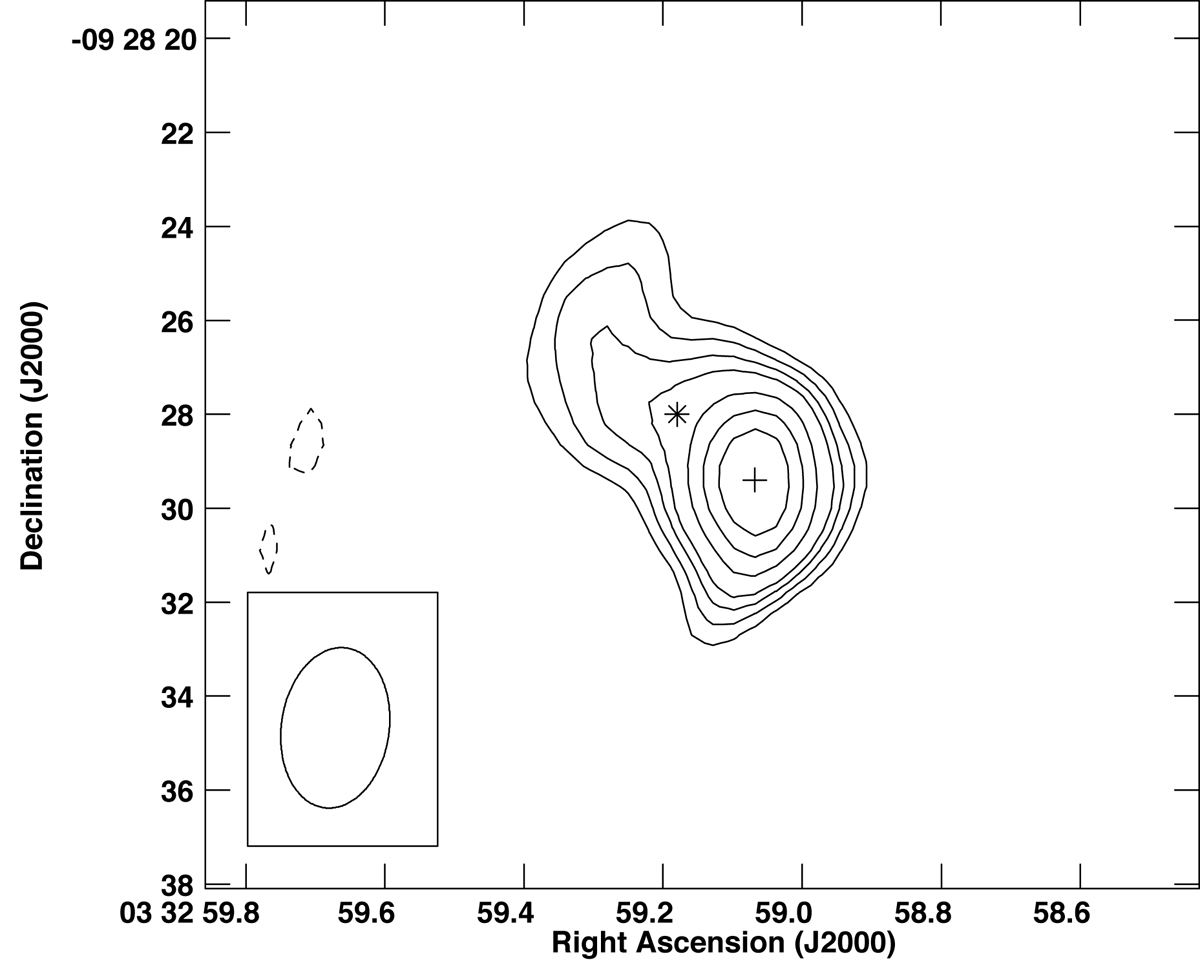
10.0 GHz image of the VLA11 region from all the data obtained in 2020. Contours are −4, −3, 3, 4, 5, 6, 8, 10, and 12 times 2.4 μJy beam−1, the rms noise in this region of the image. The synthesized beam (![]() ; PA = −7.9°) is shown in the bottom-left corner. The cross marks the peak position of the radio emission in the observations reported here, while the asterisk marks the peak position of the 10.0 GHz emission in the lower-angular-resolution 2013 observations discussed by RLL2019.
; PA = −7.9°) is shown in the bottom-left corner. The cross marks the peak position of the radio emission in the observations reported here, while the asterisk marks the peak position of the 10.0 GHz emission in the lower-angular-resolution 2013 observations discussed by RLL2019.
Current usage metrics show cumulative count of Article Views (full-text article views including HTML views, PDF and ePub downloads, according to the available data) and Abstracts Views on Vision4Press platform.
Data correspond to usage on the plateform after 2015. The current usage metrics is available 48-96 hours after online publication and is updated daily on week days.
Initial download of the metrics may take a while.