Fig. 9
Download original image
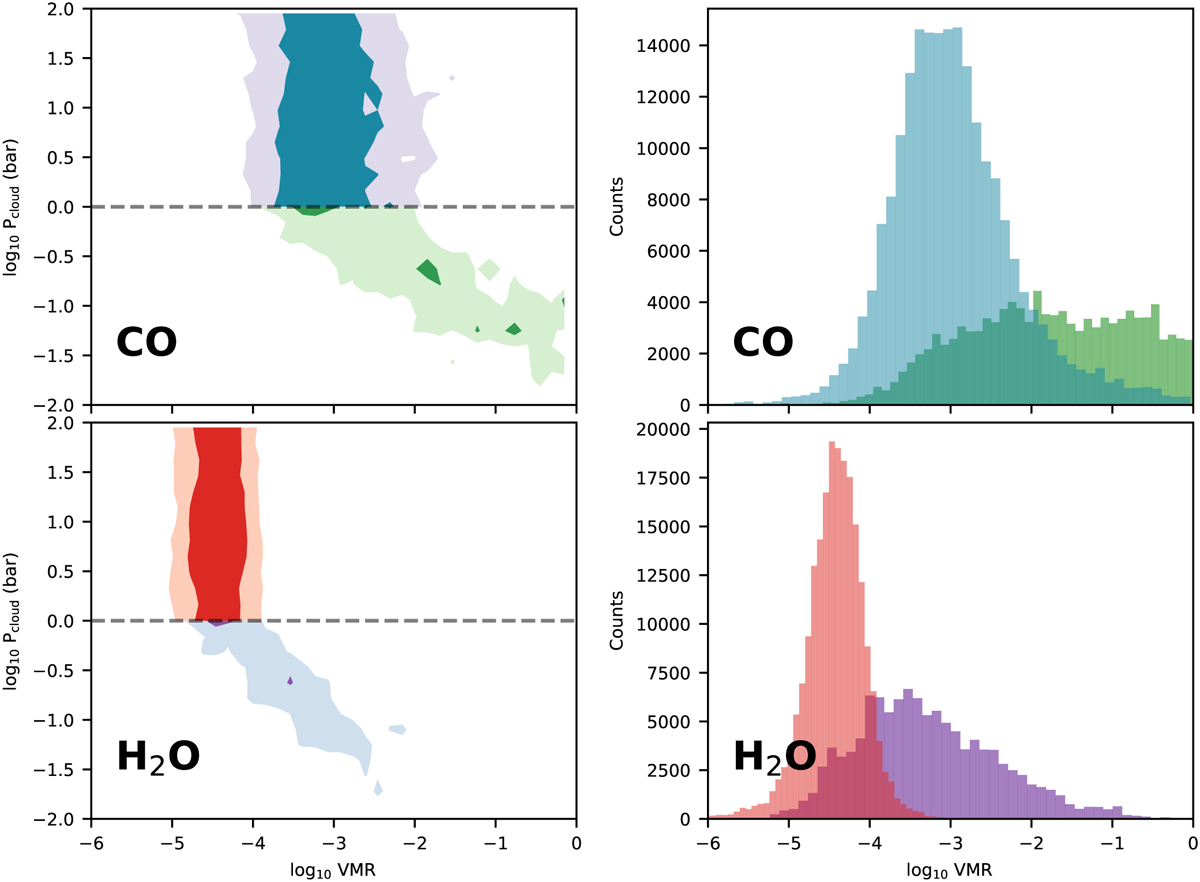
Posterior distributions of the CO abundance (top panels) and H2O abundance (bottom panels). The left panels show the correlation between the VMRs and the cloud deck pressure, and the right panels show the total distribution of the VMRs divided into two subsets: with log10 Pcloud > 0 (blue and red) and with log10 Pcloud < 0 (green and purple). The threshold (indicated by the dashed line) is caused by collision-induced absorption, which blocks any signals originating in the deeper layers.
Current usage metrics show cumulative count of Article Views (full-text article views including HTML views, PDF and ePub downloads, according to the available data) and Abstracts Views on Vision4Press platform.
Data correspond to usage on the plateform after 2015. The current usage metrics is available 48-96 hours after online publication and is updated daily on week days.
Initial download of the metrics may take a while.