Fig. 8
Download original image
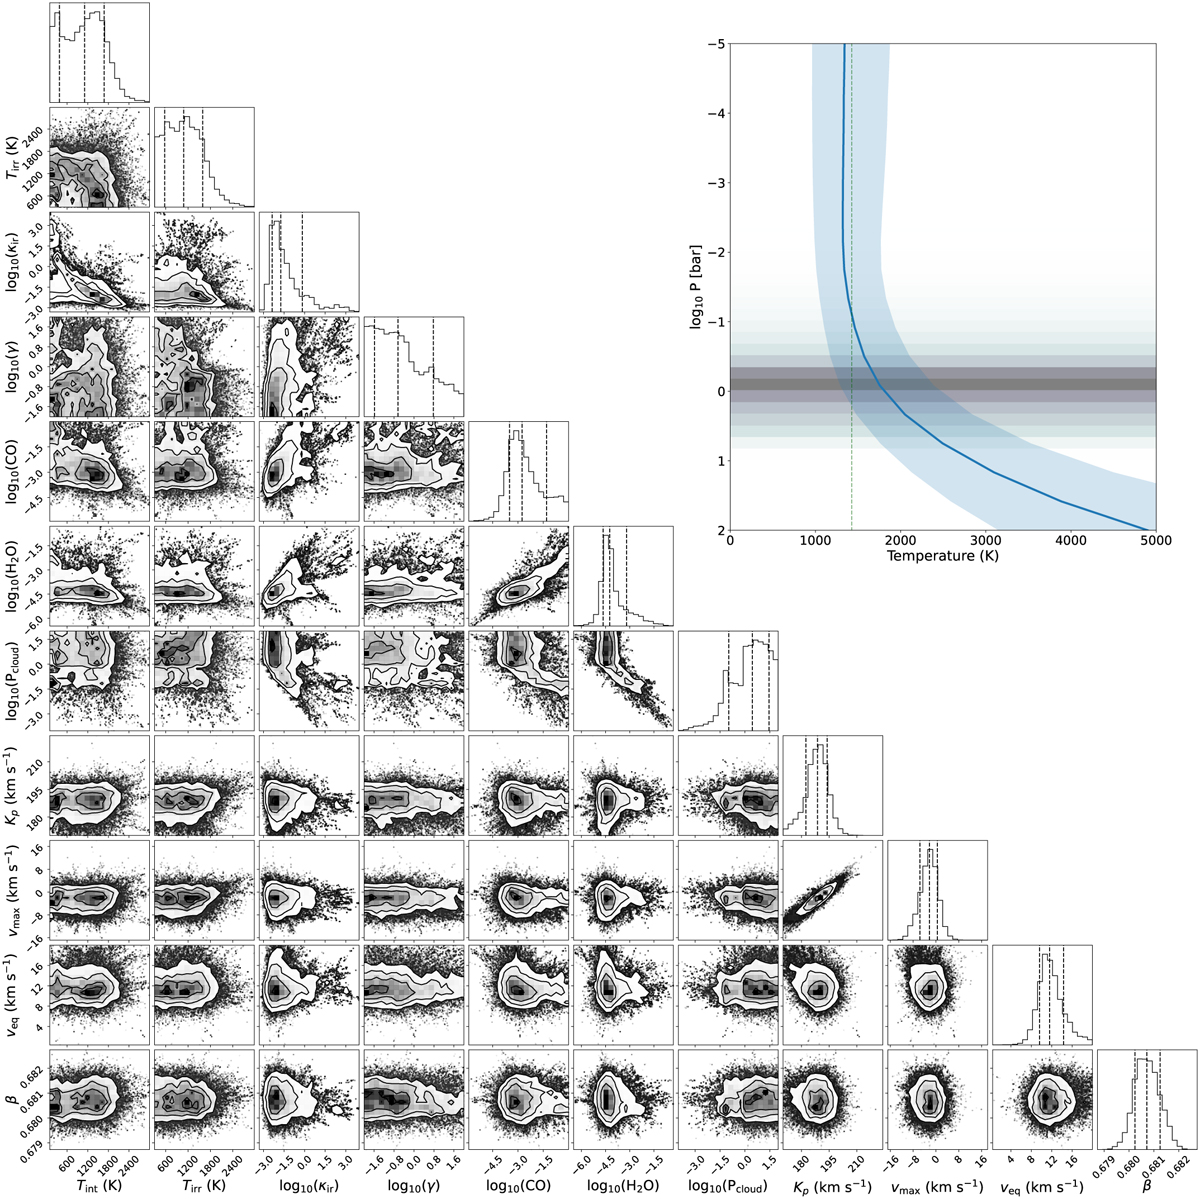
Posterior distributions of the atmospheric and orbital parameters for WASP-43b using the data of night 1. The top right panel shows the median T−p profile, which was computed from 10 000 random samples of the MCMC walkers. The blue shaded region indicates the 1σ uncertainty interval, while the vertical dotted line shows the equilibrium temperature of WASP-43b (Teq = 1426.7 K). The mean contribution function for the wavelength range of our observation is shown in grey.
Current usage metrics show cumulative count of Article Views (full-text article views including HTML views, PDF and ePub downloads, according to the available data) and Abstracts Views on Vision4Press platform.
Data correspond to usage on the plateform after 2015. The current usage metrics is available 48-96 hours after online publication and is updated daily on week days.
Initial download of the metrics may take a while.