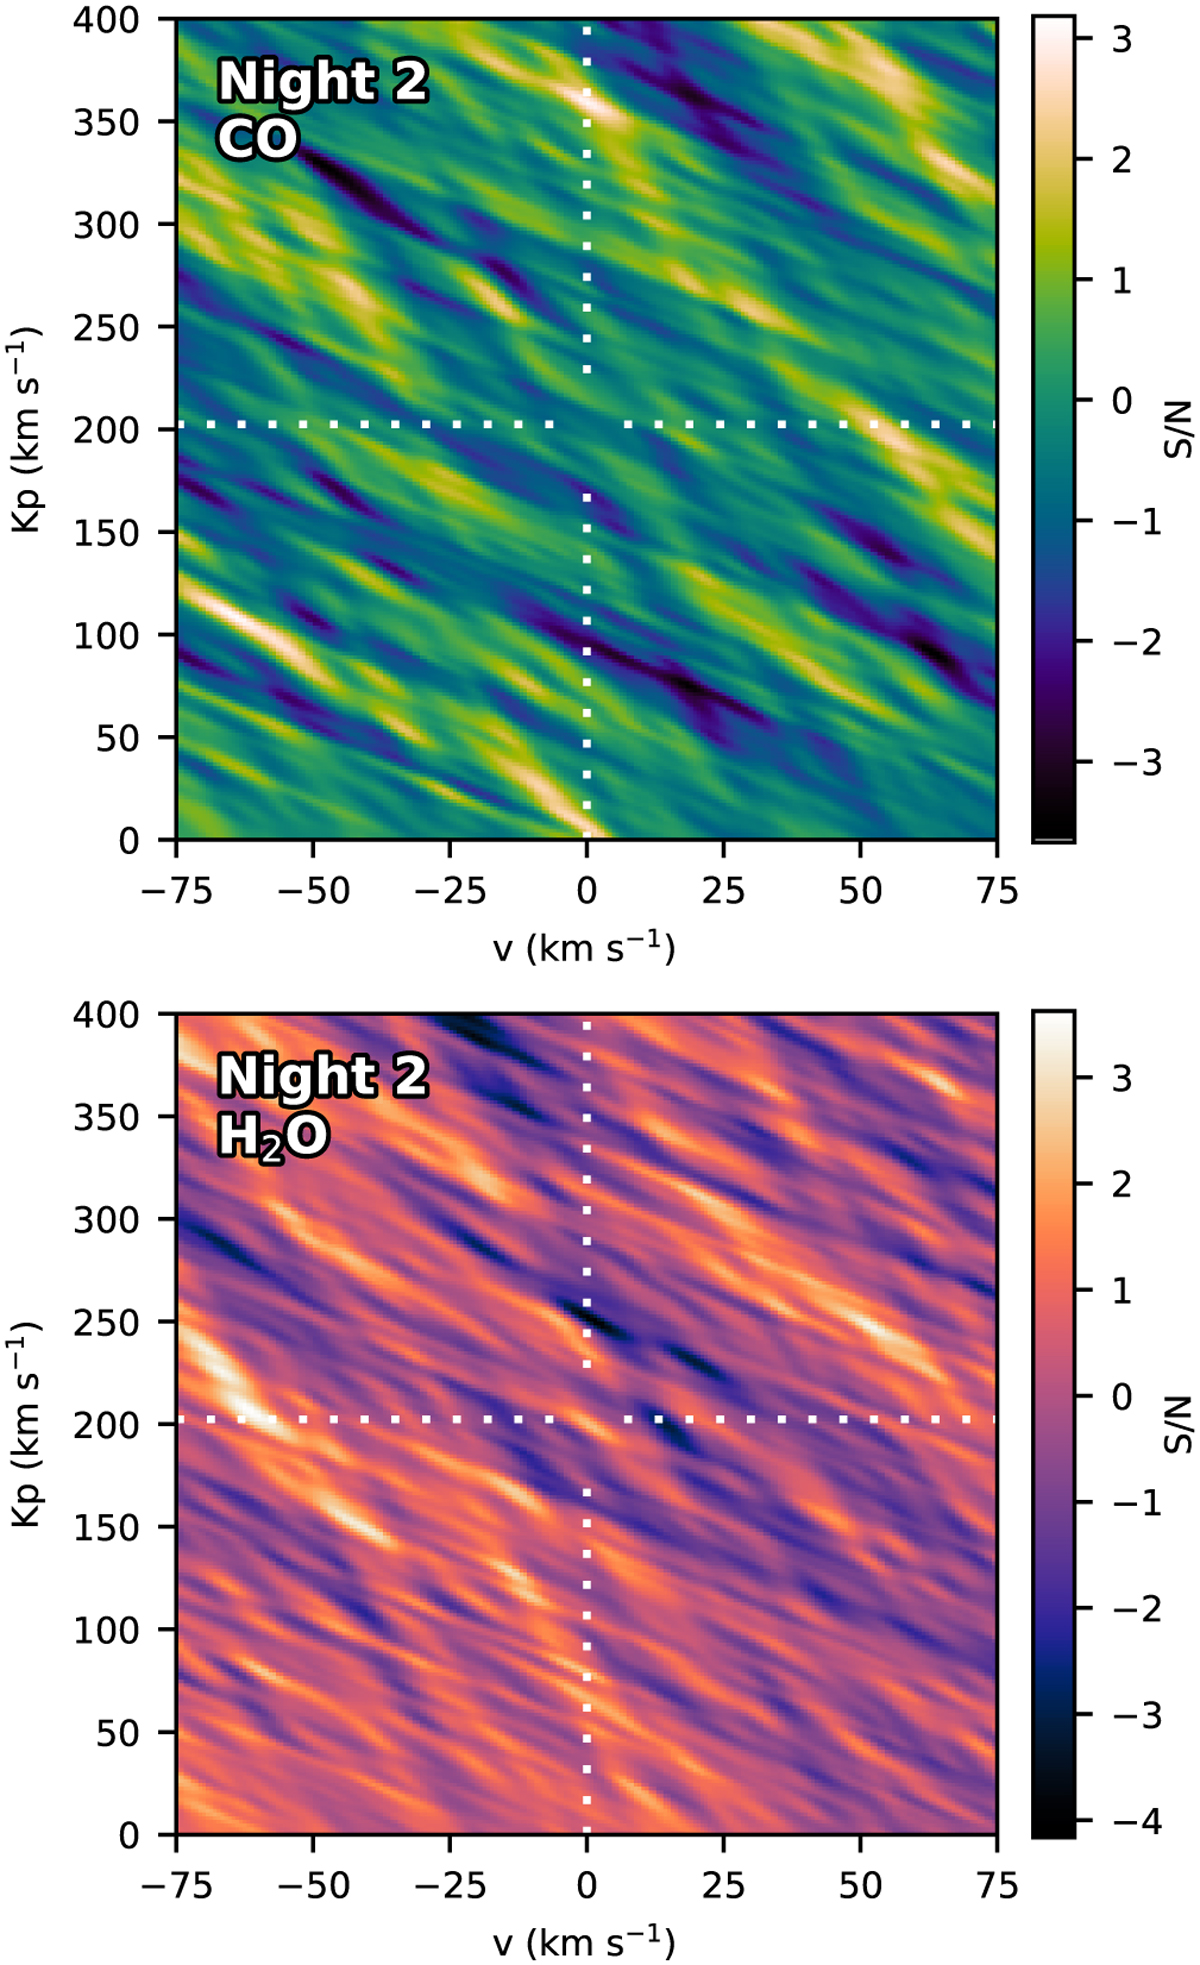
Fig. B.1
Download original image
Kp-υsys map for the CO signal (top panel) and H2O signal (bottom panel) in night 2 after eight SYSREM iterations. The white dotted lines indicate the expected position of a signal at the literature Kp value in the planetary rest-frame. The absence of a significant signal in either of these species can be attributed to the poor data quality of night 2.
Current usage metrics show cumulative count of Article Views (full-text article views including HTML views, PDF and ePub downloads, according to the available data) and Abstracts Views on Vision4Press platform.
Data correspond to usage on the plateform after 2015. The current usage metrics is available 48-96 hours after online publication and is updated daily on week days.
Initial download of the metrics may take a while.