Open Access
Fig. 9.
Download original image
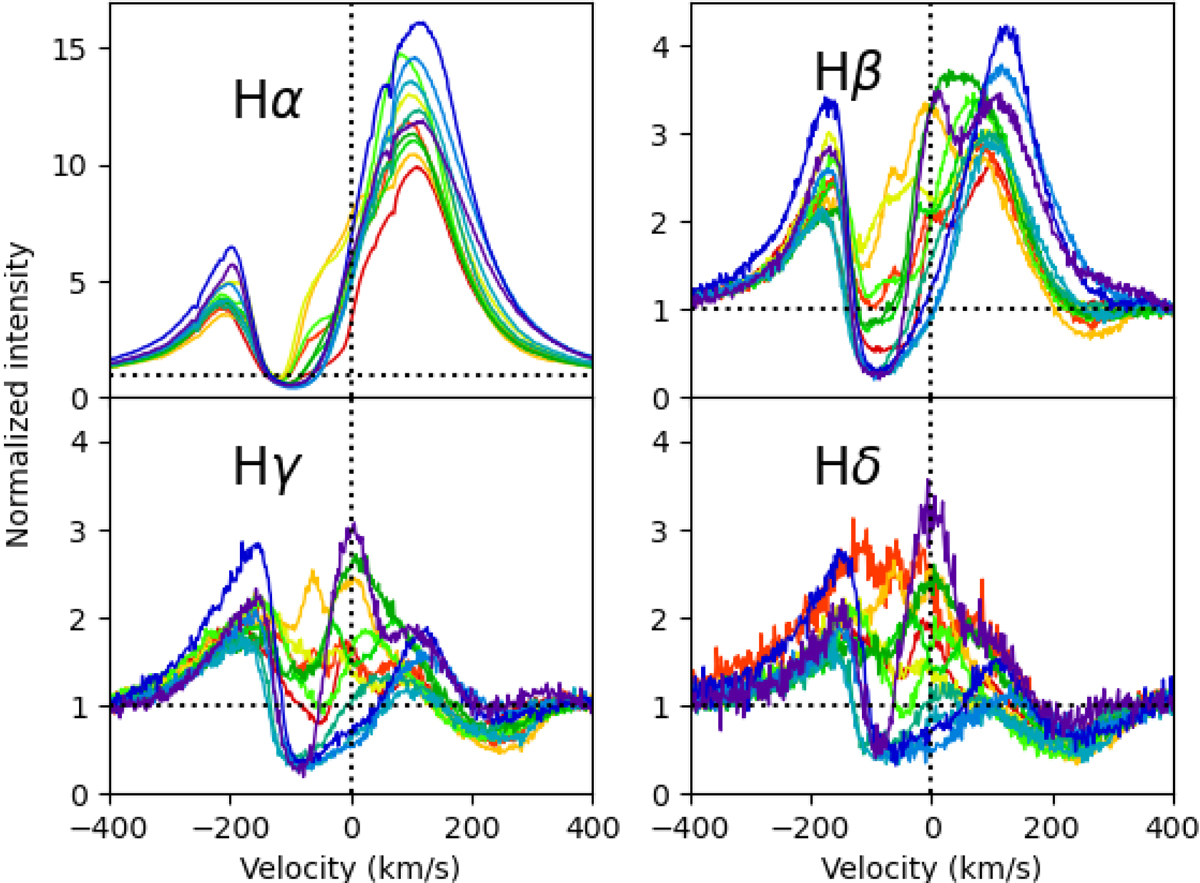
Balmer series in S CrA N. The color code is the same as Fig. 2. The vertical dotted line shows the stellar radial velocity, and the horizontal dotted lines show the continuum level for each line. The y-scale of Hα has been changed for clarity.
Current usage metrics show cumulative count of Article Views (full-text article views including HTML views, PDF and ePub downloads, according to the available data) and Abstracts Views on Vision4Press platform.
Data correspond to usage on the plateform after 2015. The current usage metrics is available 48-96 hours after online publication and is updated daily on week days.
Initial download of the metrics may take a while.