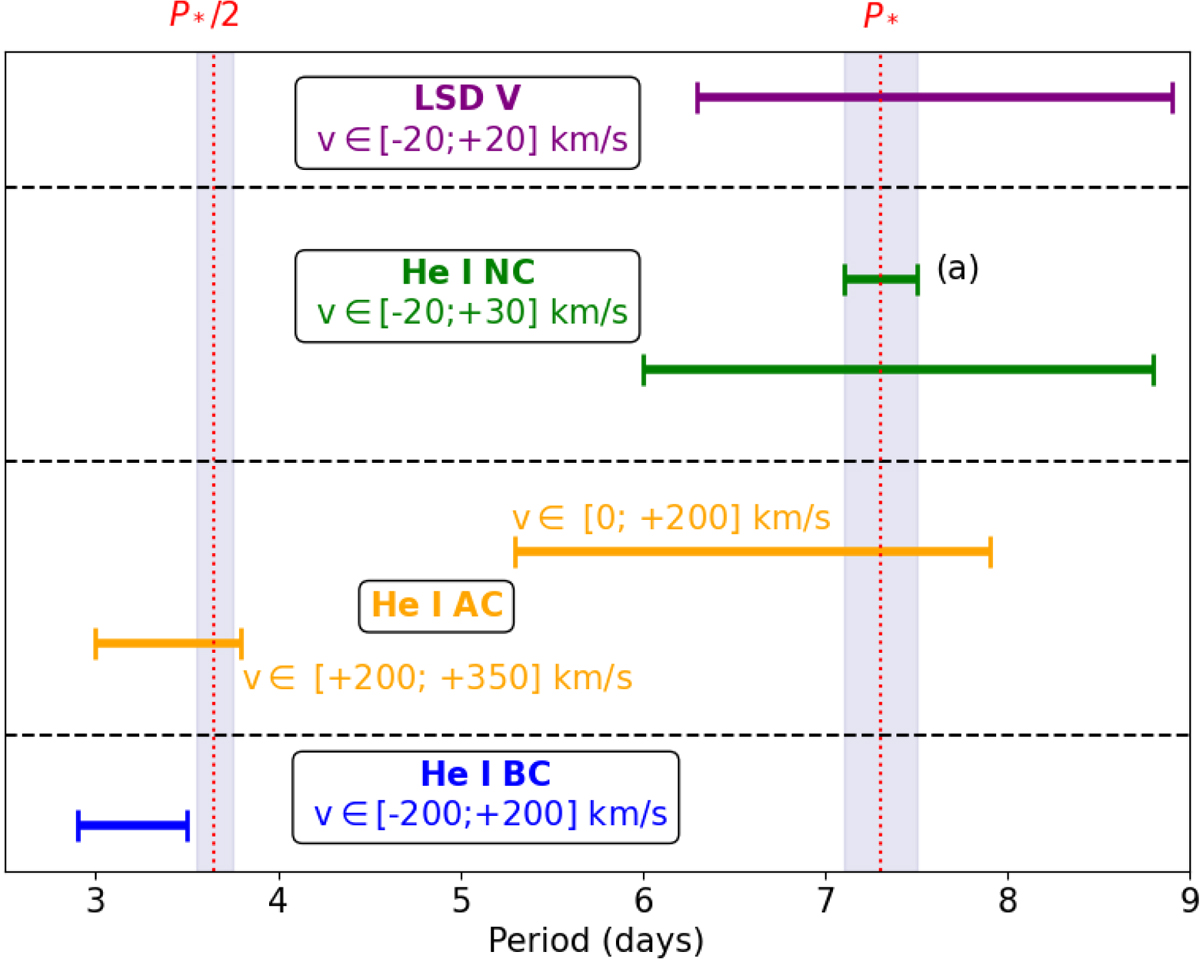
Fig. 8.
Download original image
Comparison of all the periods derived in this study, gathered according to the profile from which they arose. The dashed vertical red lines illustrate the stellar rotation period (P*) and half its value, surrounded by their uncertainty (light blue shade). All values are estimated from 2D periodograms except for (a), which is derived from radial velocities, and is chosen as P*.
Current usage metrics show cumulative count of Article Views (full-text article views including HTML views, PDF and ePub downloads, according to the available data) and Abstracts Views on Vision4Press platform.
Data correspond to usage on the plateform after 2015. The current usage metrics is available 48-96 hours after online publication and is updated daily on week days.
Initial download of the metrics may take a while.