Fig. 7.
Download original image
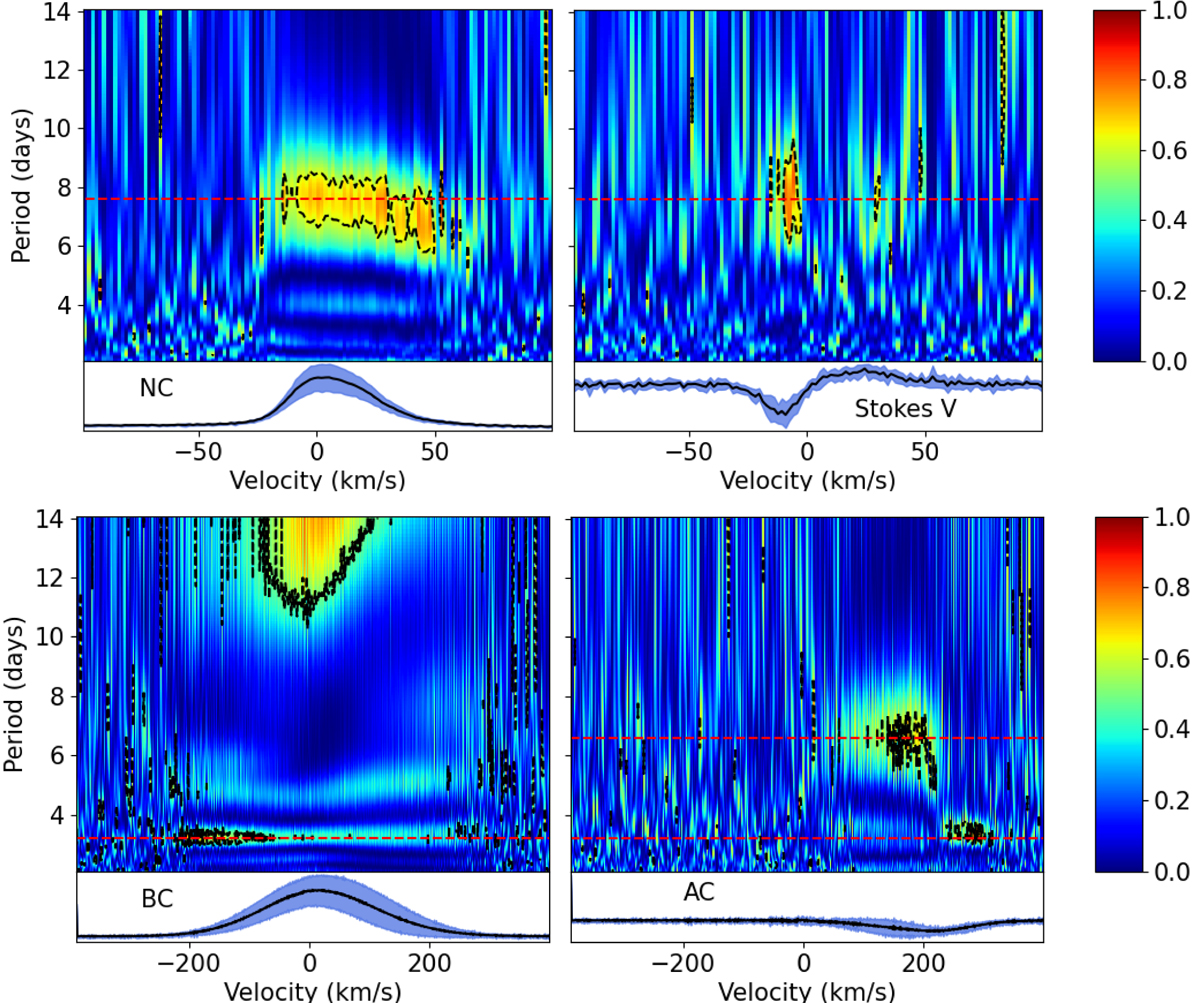
2D periodograms of the Stokes I NC (upper left), BC (lower left), AC (lower right), and Stokes V (upper right) in He I λ5876. The dashed red lines mark a period of 7.4 days (NC and Stokes V), 3.2 days (BC and AC), and 6.6 days (AC). The dashed black contours denote a constant FAP of 3% (except for 15% for the BC). The average profiles (black line) surrounded by their 1σ deviations (light blue) are shown below the periodograms.
Current usage metrics show cumulative count of Article Views (full-text article views including HTML views, PDF and ePub downloads, according to the available data) and Abstracts Views on Vision4Press platform.
Data correspond to usage on the plateform after 2015. The current usage metrics is available 48-96 hours after online publication and is updated daily on week days.
Initial download of the metrics may take a while.