Fig. 5.
Download original image
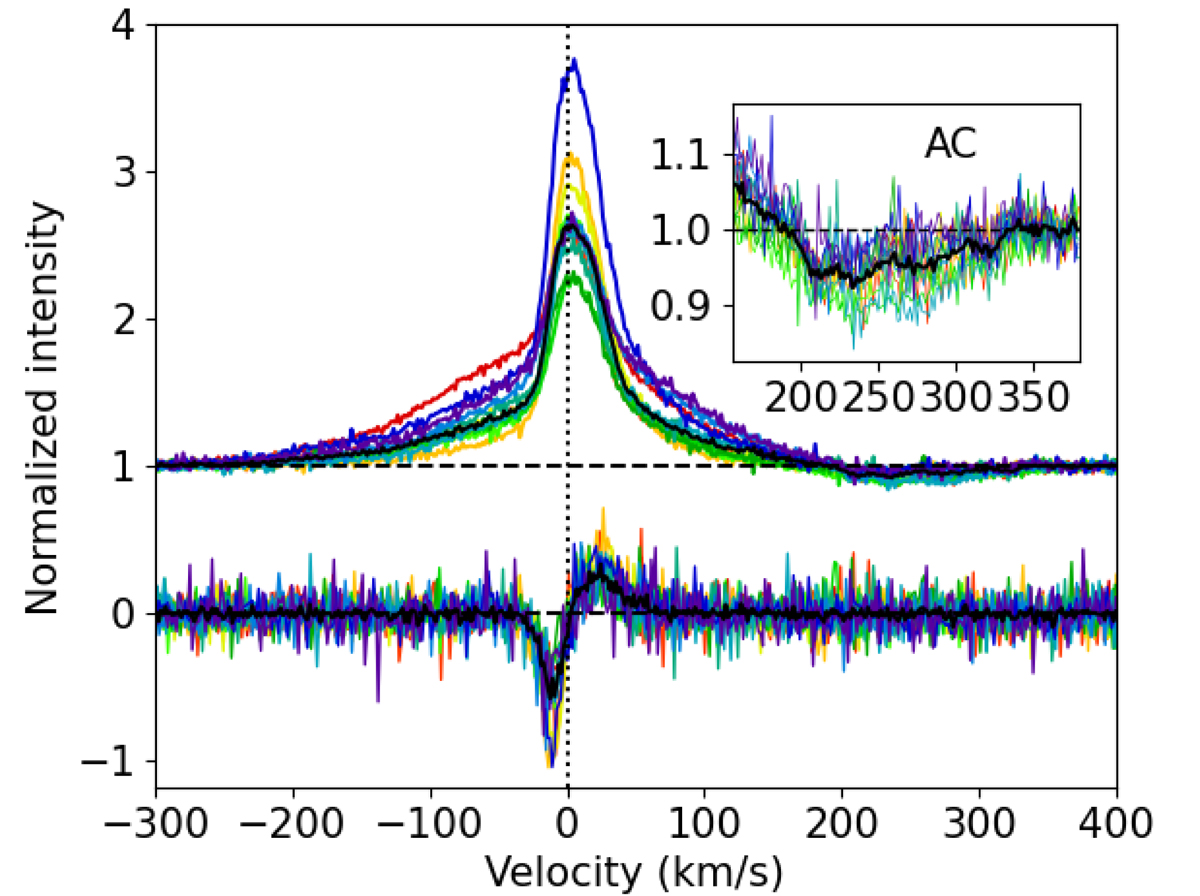
He I λ5876 line for all observations. Stokes I (top) is normalized in intensity with respect to the continuum. Stokes V (bottom) is magnified by a factor of 5 for clarity. The color code is the same as in Fig. 2. The solid black lines are the average spectra. The dashed black lines represent the continuum level for each component. The dotted black line is the radial velocity of the star. The inset plot is a zoom on the absorption component.
Current usage metrics show cumulative count of Article Views (full-text article views including HTML views, PDF and ePub downloads, according to the available data) and Abstracts Views on Vision4Press platform.
Data correspond to usage on the plateform after 2015. The current usage metrics is available 48-96 hours after online publication and is updated daily on week days.
Initial download of the metrics may take a while.