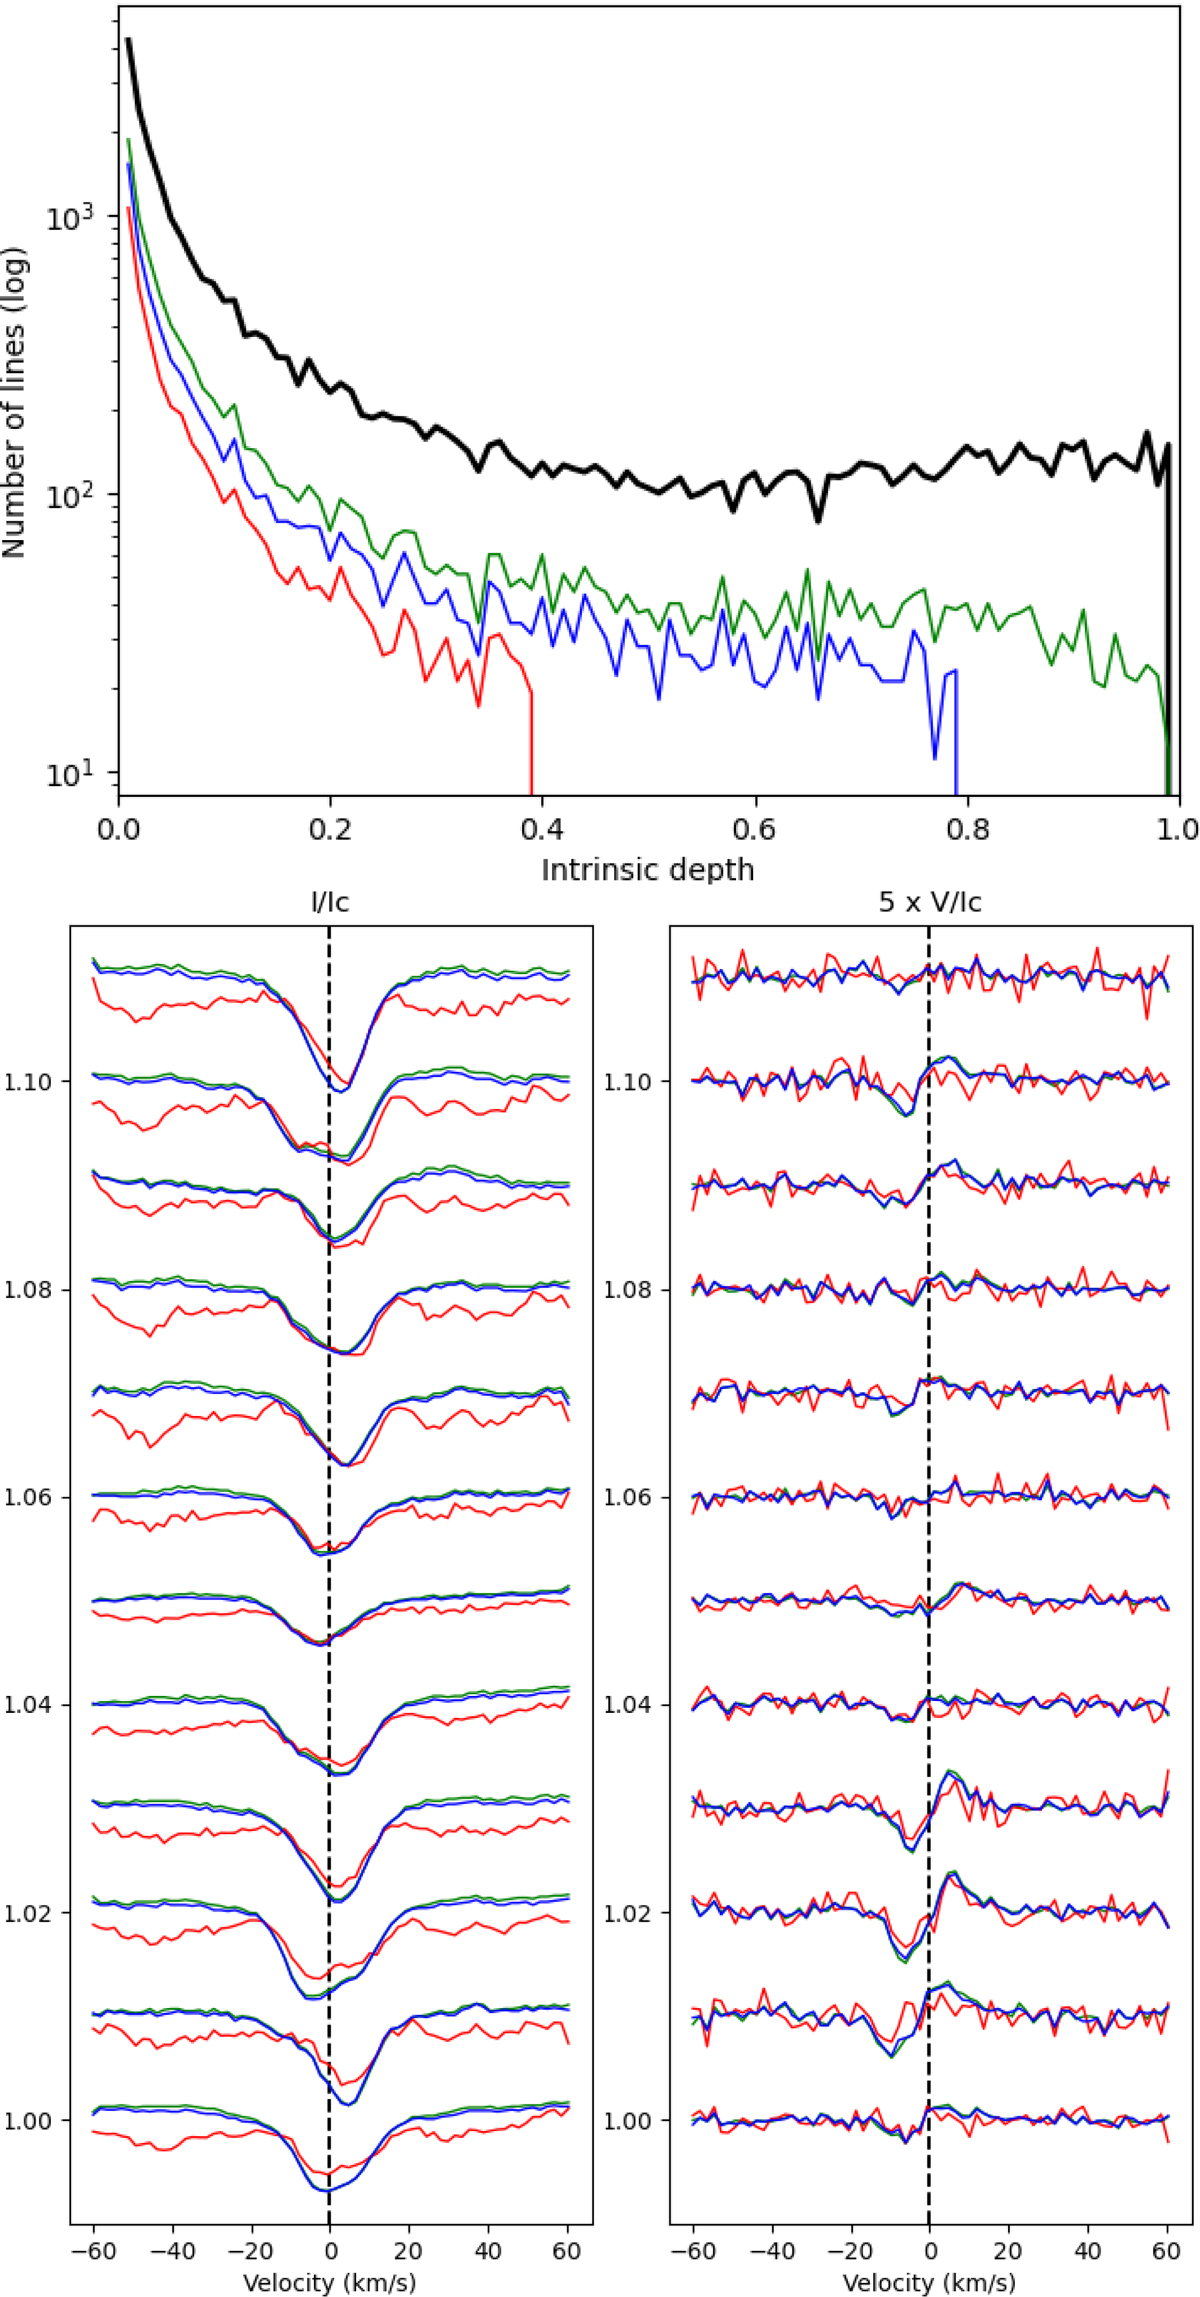
Fig. B.3.
Download original image
Illustration of the line depth test. Top: Number of lines included in each mask as a function of their intrinsic depth. Bottom left: LSD I profiles associated with each mask. Bottom right: LSD V profiles (magnified by a factor 5 for clarity) associated with each mask. The black curve stands for the raw synthetic spectrum. The green curve corresponds to the mask used in this study. The blue curve corresponds to a depth limit of 0.8. The red curve corresponds to a depth limit of 0.4.
Current usage metrics show cumulative count of Article Views (full-text article views including HTML views, PDF and ePub downloads, according to the available data) and Abstracts Views on Vision4Press platform.
Data correspond to usage on the plateform after 2015. The current usage metrics is available 48-96 hours after online publication and is updated daily on week days.
Initial download of the metrics may take a while.