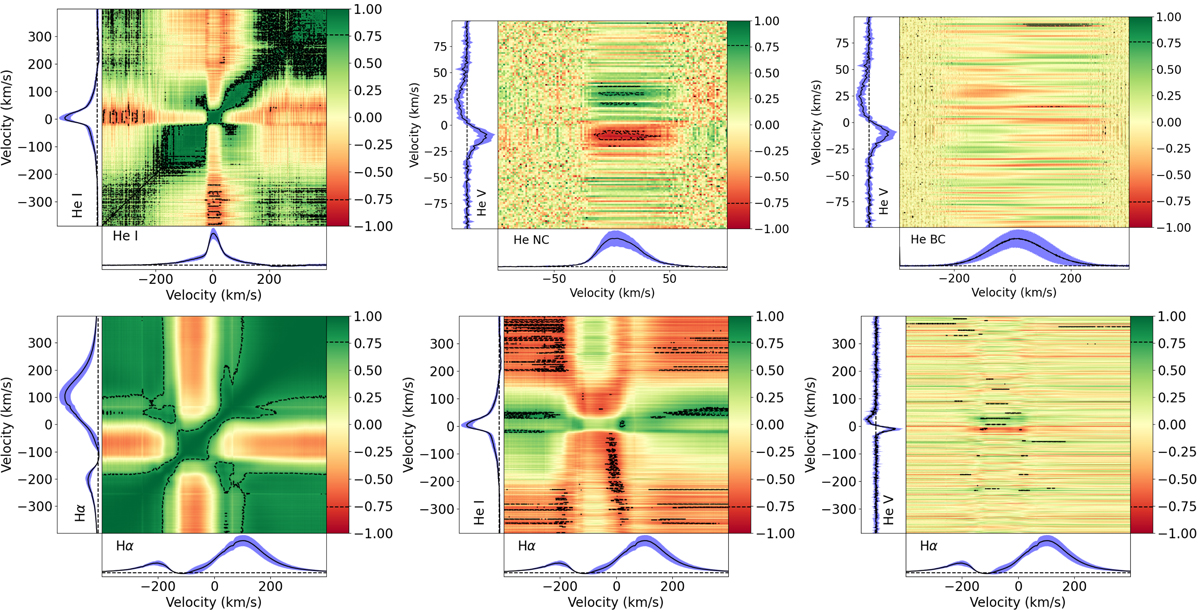
Fig. 10.
Download original image
Correlation matrices in He I (top row). Autocorrelation of the full helium line at 587.6 nm (left), correlation between the He I NC and the V profile (middle), and correlation between the He I BC and the V profile (right). Correlations matrices in Hα (bottom row). Autocorrelation of the full Hα line (left), correlation between the Hα line and the full He I line (middle), and correlation between the Hα line and the He I V profile (right). The dashed black contours show the 2σ significance level. The average profiles are represented at the bottom and left side of each panel (solid black line) and are surrounded by their standard deviation (light blue shade). The continuum level is shown with dashed black lines.
Current usage metrics show cumulative count of Article Views (full-text article views including HTML views, PDF and ePub downloads, according to the available data) and Abstracts Views on Vision4Press platform.
Data correspond to usage on the plateform after 2015. The current usage metrics is available 48-96 hours after online publication and is updated daily on week days.
Initial download of the metrics may take a while.