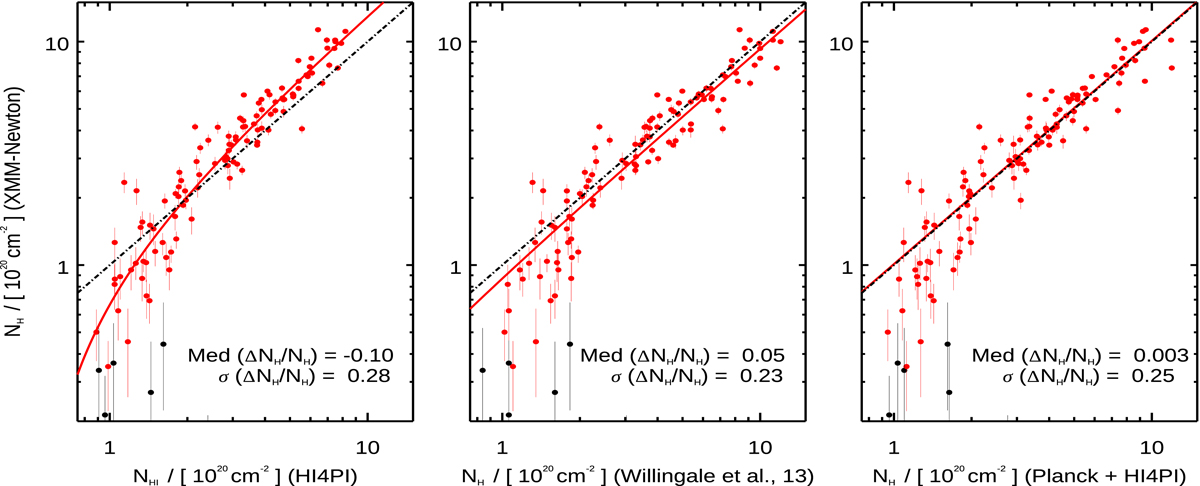
Fig. 6.
Download original image
X-ray absorption compared with hydrogen density column estimates toward CHEX-MATE galaxy clusters. Left panel: neutral atomic hydrogen density column derived from the HI4PI survey. Middle panel: total hydrogen density column estimated using the method of Willingale et al. (2013). Right panel: total hydrogen density column estimated in this work using the Planck and HI4PI surveys. XMM-Newton measurements are jointly fitted with projected temperature and metallicity of the intra-cluster gas in an annular region delimited by a cluster-centric radius range of [0.15, 0.6]×r500. The red (black) data points indicate X-ray measurements achieved with an S/N higher (lower) than 2. The red curves depict a linear regression through red points. The labels in the lower right corner of each plot indicate the median, Med(ΔNH/NH), and standard deviation, σ(ΔNH/NH), of the relative differences separating both coordinates of each red point. The dash-dotted lines indicate the identity line that is most similar to the best-fit line in the right panel.
Current usage metrics show cumulative count of Article Views (full-text article views including HTML views, PDF and ePub downloads, according to the available data) and Abstracts Views on Vision4Press platform.
Data correspond to usage on the plateform after 2015. The current usage metrics is available 48-96 hours after online publication and is updated daily on week days.
Initial download of the metrics may take a while.