Fig. 1.
Download original image
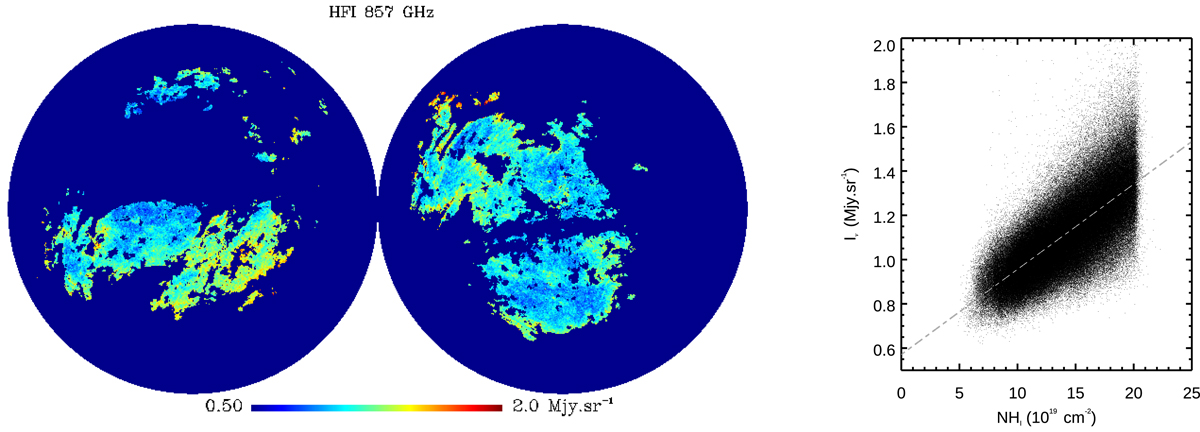
Calibration of the antenna temperature of the HFI 857 GHz map in NHI units. Left panel: HFI 857 GHz map intensity observable within a dust-gas correlation region, characterised by low NHI values, a low contribution of intermediate- or high-velocity clouds (IVC and HVC) to the NHI values, and a low contamination from thermal SZ sources (see details in Sect. 3). Right panel: pixel-to-pixel correlation and linear regression between the HFI 857 GHz and HI4PI NHI maps in the sky region visible in the left panel.
Current usage metrics show cumulative count of Article Views (full-text article views including HTML views, PDF and ePub downloads, according to the available data) and Abstracts Views on Vision4Press platform.
Data correspond to usage on the plateform after 2015. The current usage metrics is available 48-96 hours after online publication and is updated daily on week days.
Initial download of the metrics may take a while.