Open Access
Fig. B.1
Download original image
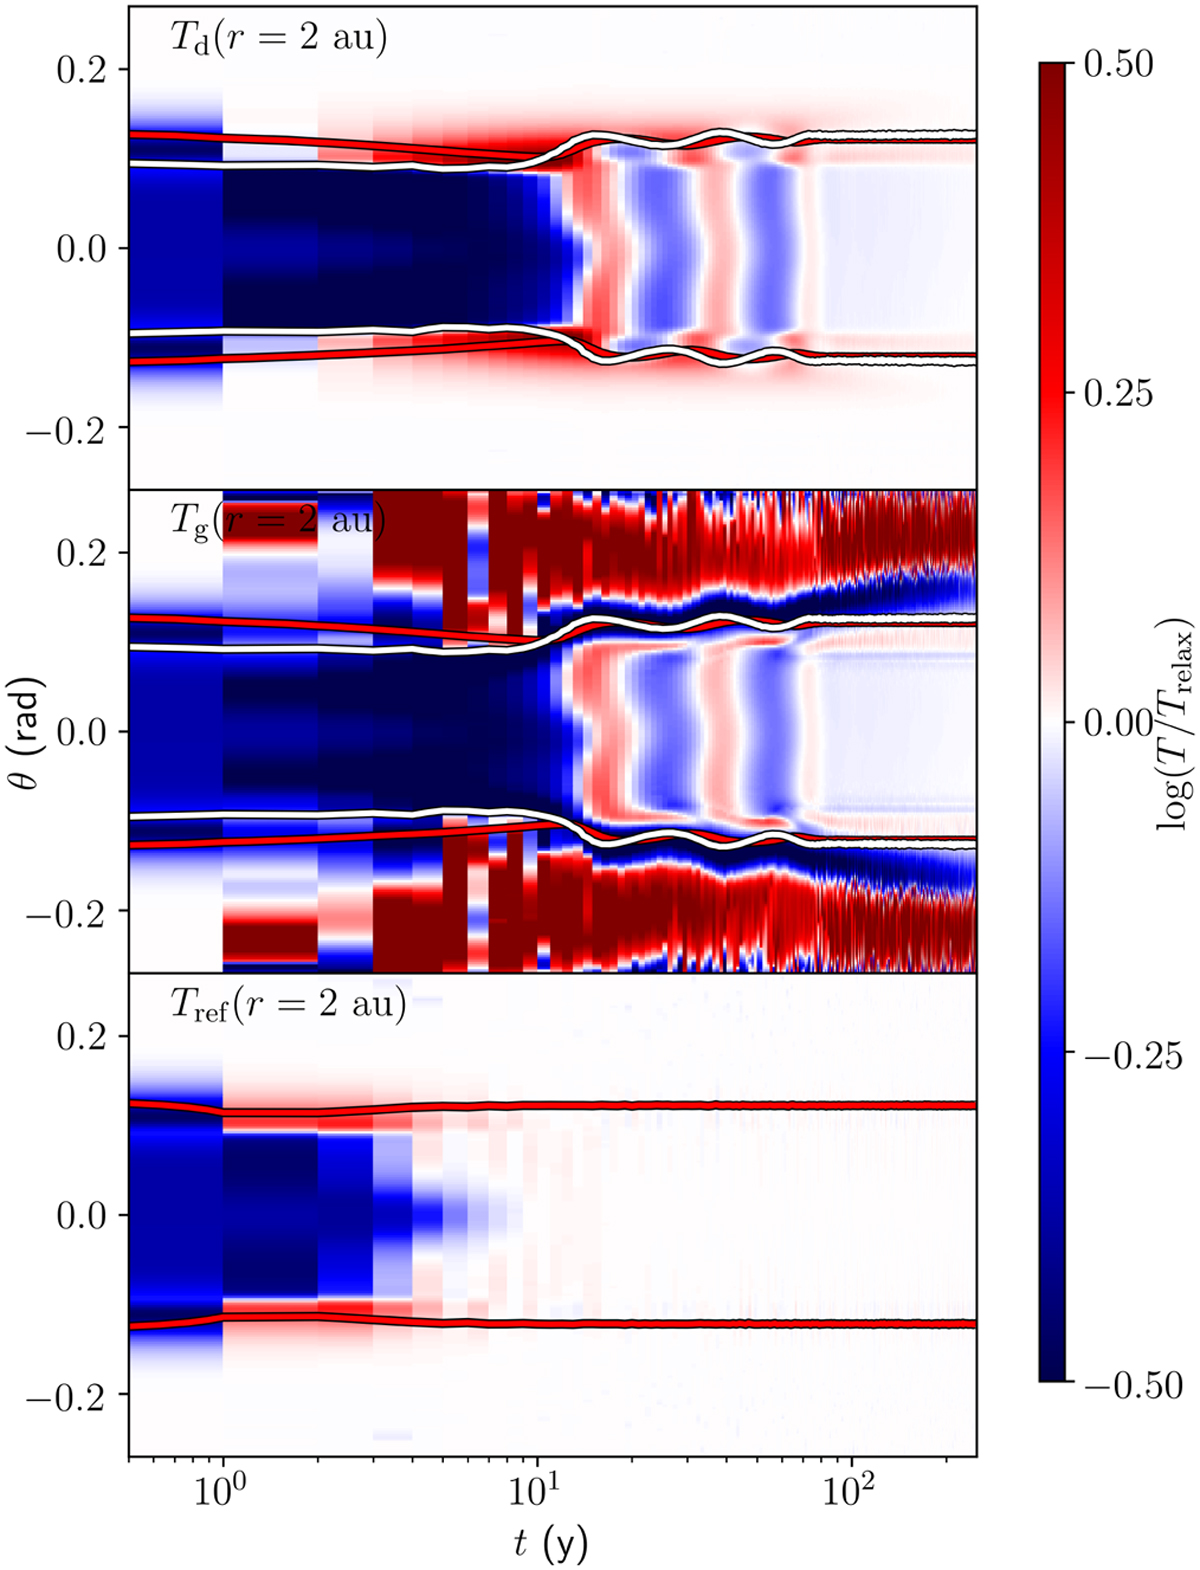
Plot similar to our Figure 5, but with Td and Tg taken from our simulation with cooling times artificially raised by a factor of 100. There are clear vertical patterns in the dust and gas temperature profiles, corresponding to inward-traveling perturbations at the τr = 1 surface characteristic of the SSI.
Current usage metrics show cumulative count of Article Views (full-text article views including HTML views, PDF and ePub downloads, according to the available data) and Abstracts Views on Vision4Press platform.
Data correspond to usage on the plateform after 2015. The current usage metrics is available 48-96 hours after online publication and is updated daily on week days.
Initial download of the metrics may take a while.