Fig. 5
Download original image
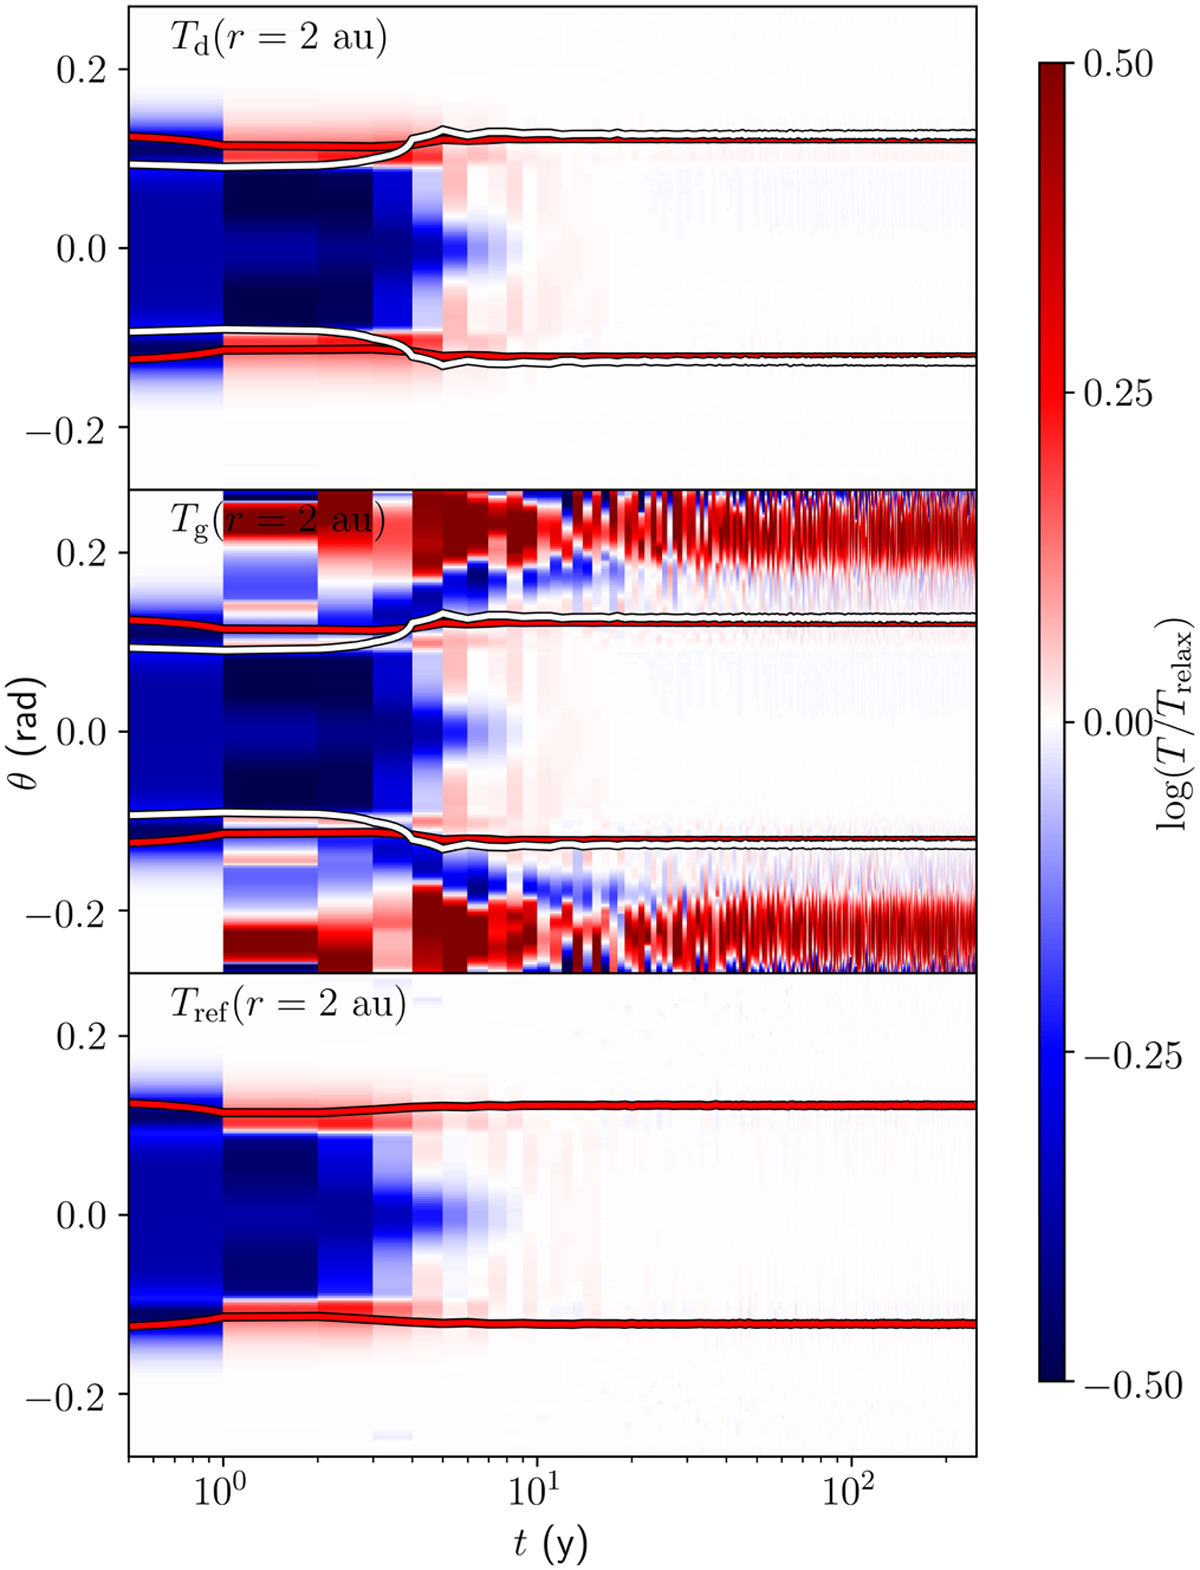
Time evolution of Td (top), Tg (center), and Tref (bottom) in a disk column at the fiducial r = 2 au, as compared to the final, relaxed state of Tref. As in Fig. 4, we plot the τr = 1 optical surface in red and the ß = 1 cooling surface in white. Tref, as well as Td and Tg, rapidly relax to a smooth equilibrium disk inside the ß = 1 surface. Sound waves in the upper atmosphere, excited by the initial relaxation of the disk, are visible in Tg due to the slow cooling rate at high altitude.
Current usage metrics show cumulative count of Article Views (full-text article views including HTML views, PDF and ePub downloads, according to the available data) and Abstracts Views on Vision4Press platform.
Data correspond to usage on the plateform after 2015. The current usage metrics is available 48-96 hours after online publication and is updated daily on week days.
Initial download of the metrics may take a while.