Fig. 4
Download original image
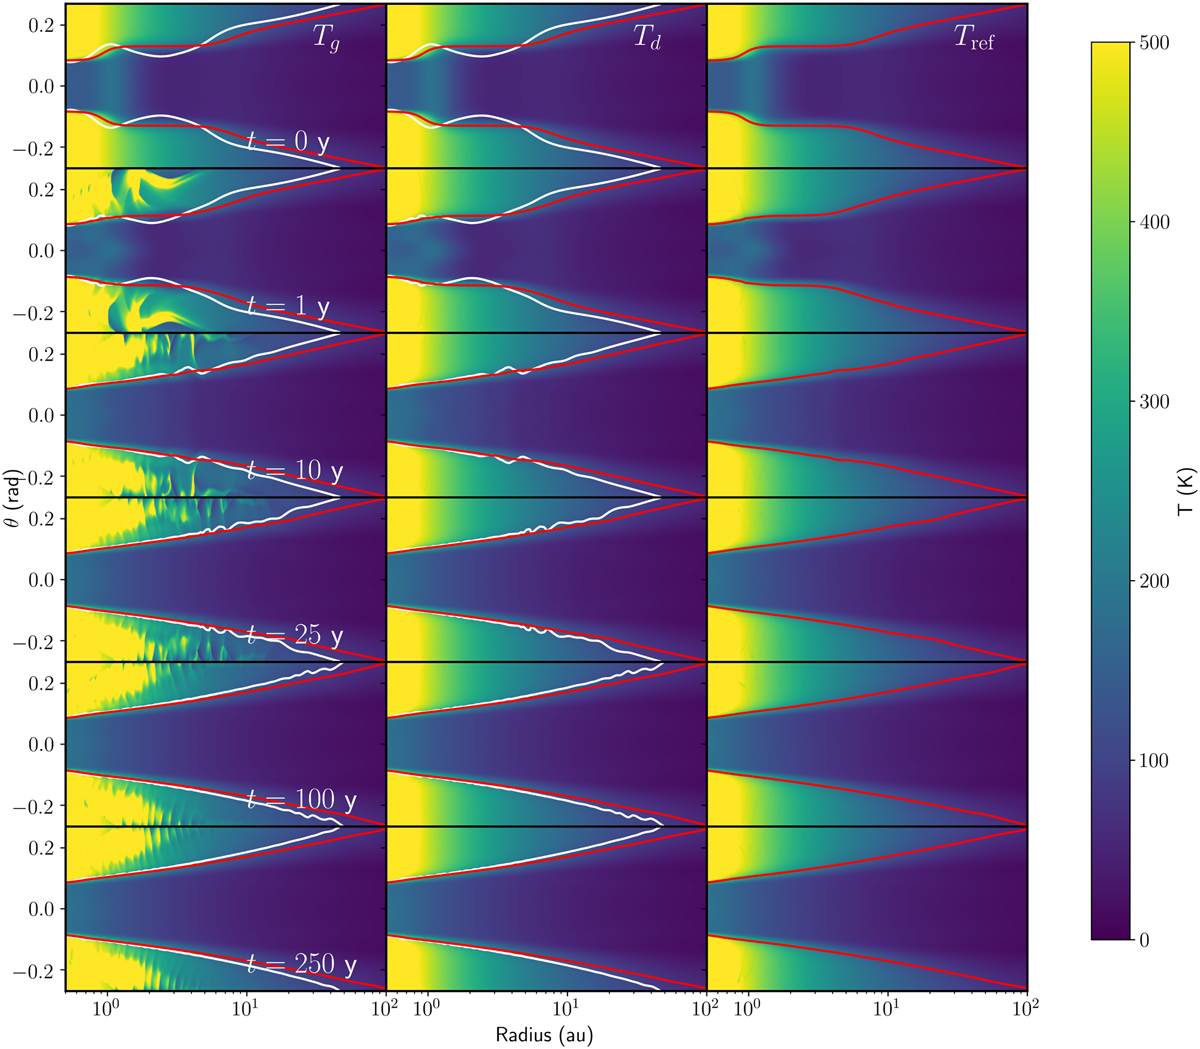
2D temperature profiles from our SSI tests. The Tg (left) and Td (middle) columns come from our simulations with realistic ts, whereas Tref (right) is from our reference simulations with ts = (2π)−1 × 10⁻¹⁰ yr. For ease of interpretation, we overplot β = 1 (white) and τ = 1 (red) surfaces. The reference disk relaxes rapidly to a smooth hydrostatic configuration; the bulk of the realistic disk does so as well, although differences persist in the slowly-cooling disk atmosphere.
Current usage metrics show cumulative count of Article Views (full-text article views including HTML views, PDF and ePub downloads, according to the available data) and Abstracts Views on Vision4Press platform.
Data correspond to usage on the plateform after 2015. The current usage metrics is available 48-96 hours after online publication and is updated daily on week days.
Initial download of the metrics may take a while.