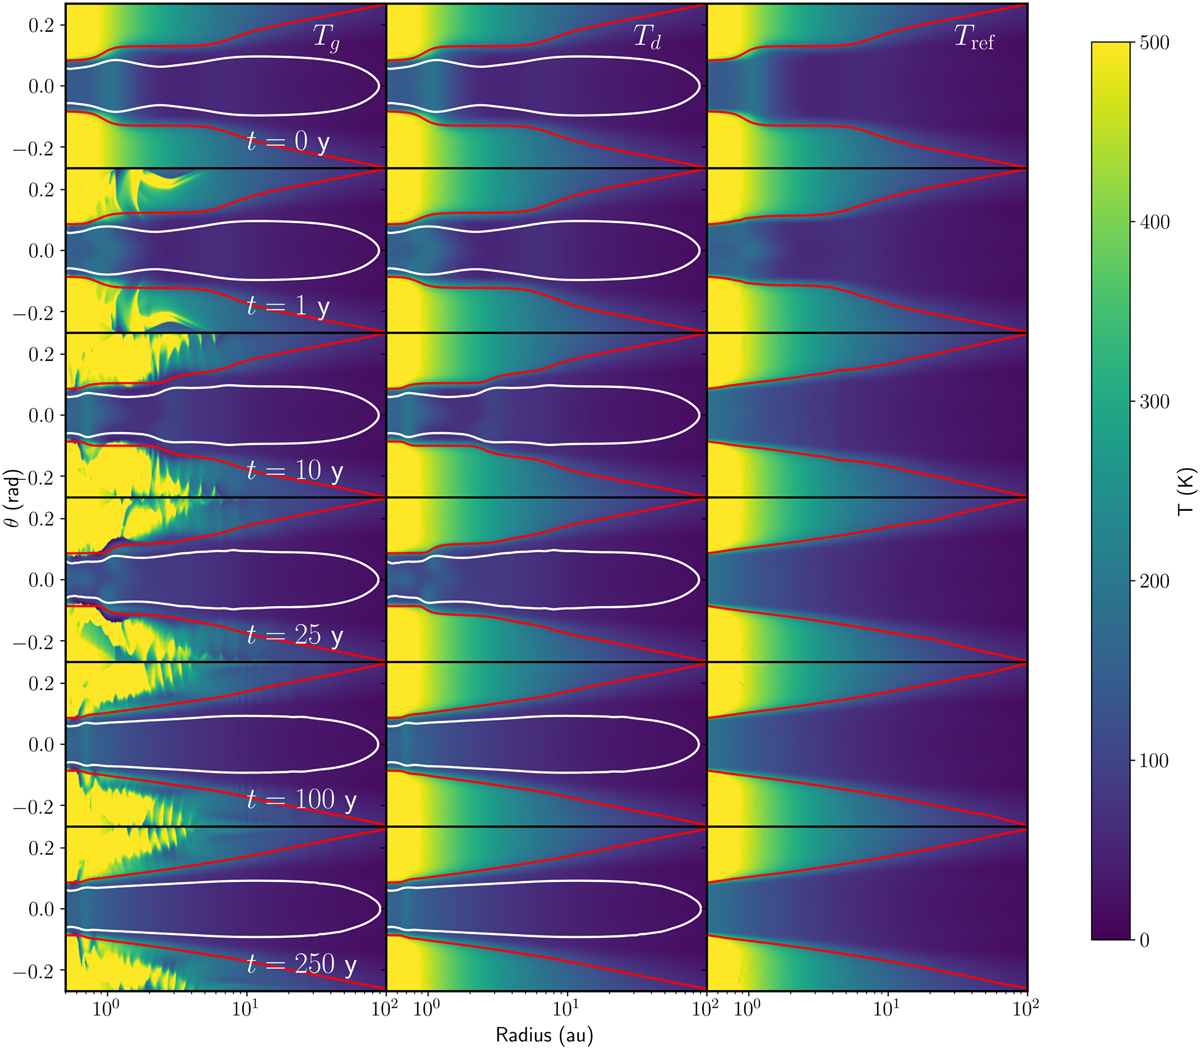
Fig. B.3
Download original image
Evolution of the SSI with a dust-gas coupling time 100× longer than in the self-consistent setup presented in 3.3. An inward-propagating SSI bump is clearly visible. At t = 250 y, the disk has largely relaxed to the same configuration as in the reference simulation. Differences do persist, however, outside the ß = 1 surface and near the inner boundary.
Current usage metrics show cumulative count of Article Views (full-text article views including HTML views, PDF and ePub downloads, according to the available data) and Abstracts Views on Vision4Press platform.
Data correspond to usage on the plateform after 2015. The current usage metrics is available 48-96 hours after online publication and is updated daily on week days.
Initial download of the metrics may take a while.