Fig. B.2
Download original image
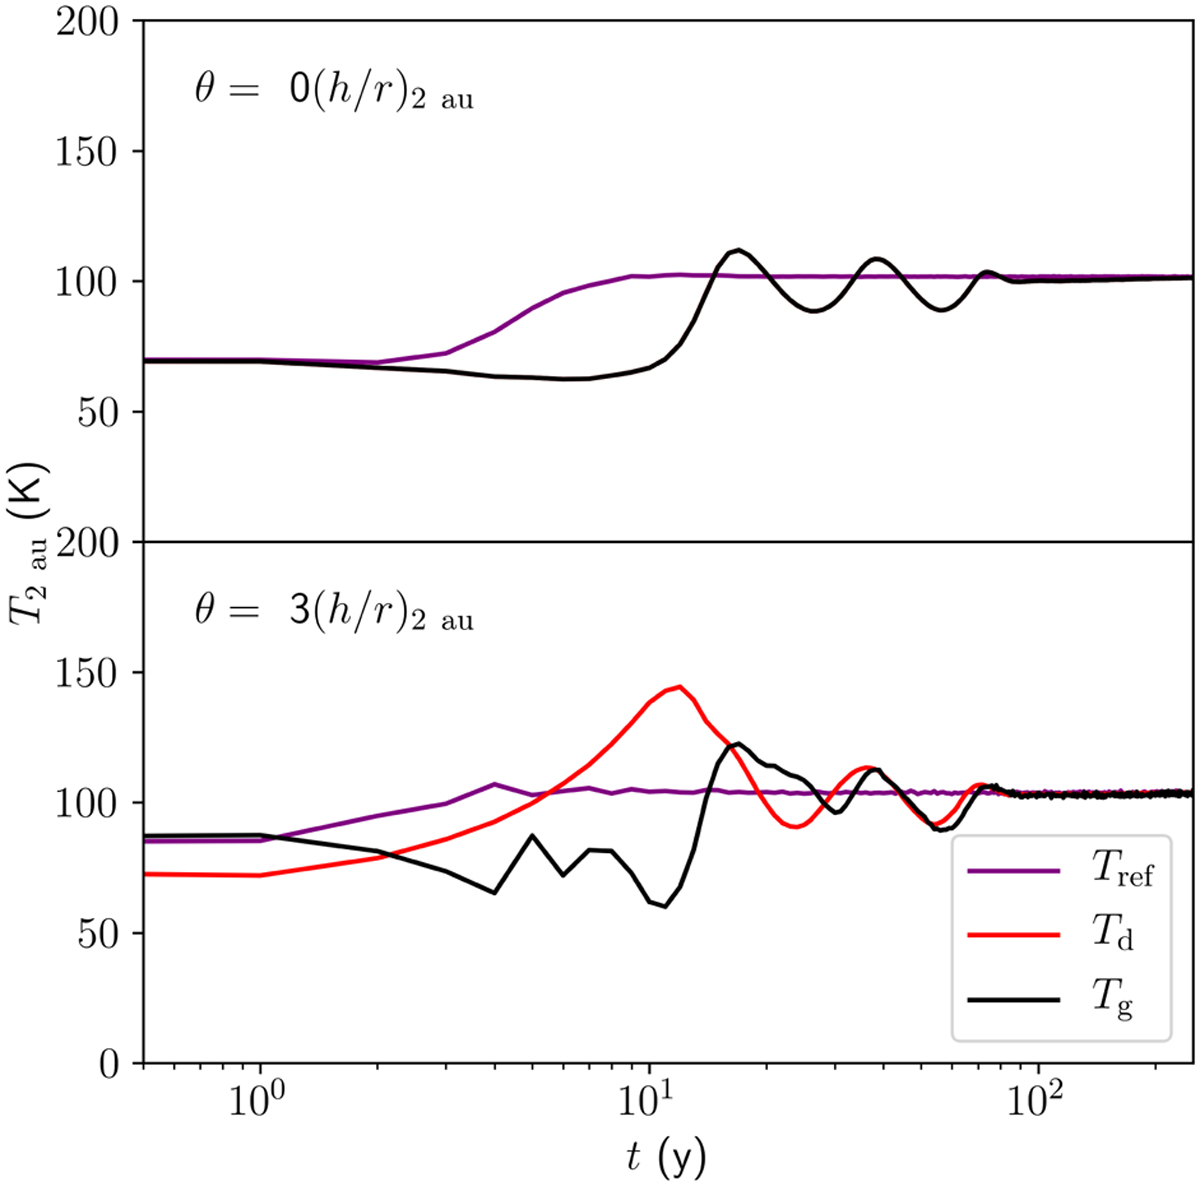
Quantitative time evolution of Td and Tg from the 100×-realistic simulation, and Tref in the reference simulation, at r = 2 au, both in the midplane (θ = 0, above) and three scale heights above it (θ ≈ 0.088, below). As qualitatively shown in Figure B.1, Tref reaches a smooth equilibrium, whereas Td and Tg exhibit damped oscillations due to the passage of self-shadowing waves. See text for more details.
Current usage metrics show cumulative count of Article Views (full-text article views including HTML views, PDF and ePub downloads, according to the available data) and Abstracts Views on Vision4Press platform.
Data correspond to usage on the plateform after 2015. The current usage metrics is available 48-96 hours after online publication and is updated daily on week days.
Initial download of the metrics may take a while.