| Issue |
A&A
Volume 678, October 2023
|
|
|---|---|---|
| Article Number | A34 | |
| Number of page(s) | 20 | |
| Section | Stellar structure and evolution | |
| DOI | https://doi.org/10.1051/0004-6361/202347047 | |
| Published online | 29 September 2023 | |
Reversing the verdict: Cataclysmic variables could be the dominant progenitors of AM CVn binaries after all
1
Departamento de Física, Universidad Técnica Federico Santa María, Av. España 1680, Valparaíso, Chile
e-mail: This email address is being protected from spambots. You need JavaScript enabled to view it.
2
Millenium Nucleus for Planet Formation, Valparaíso, Chile
e-mail: This email address is being protected from spambots. You need JavaScript enabled to view it.
Received:
29
May
2023
Accepted:
11
August
2023
Abstract
Context. AM CVn binaries are potential progenitors of thermonuclear supernovae and strong sources of persistent gravitational wave radiation. For a long time, it has been believed that these systems cannot descend from cataclysmic variables (CVs), at least not in large numbers, because the initial conditions need to be fine-tuned and, even worse, the resulting surface hydrogen abundance would be high enough to be detected which contradicts a defining feature of AM CVn binaries.
Aims. Here we show that both claimed weaknesses of the CV formation channel for AM CVn binaries are model-dependent and rely on poorly constrained assumptions for magnetic braking.
Methods. We performed binary evolution simulations with the MESA code for different combinations of post-common-envelope white dwarf and companion masses as well as orbital periods assuming the CARB model for strong magnetic braking.
Results. We found that AM CVn binaries with extremely-low surface hydrogen abundances are one natural outcome of CV evolution if the donor star has developed a non-negligible helium core prior to the onset of mass transfer. In this case, after hydrogen envelope exhaustion during CV evolution, the donor becomes degenerate and its surface hydrogen abundance substantially drops and becomes undetectable. Our simulations also show that the CV formation channel is able to explain the observed AM CVn binaries with very low mass and bloated donor stars (Gaia14aae and ZTF J1637+49).
Conclusions. CVs with evolved donors are likely the progenitors of at least a fraction of AM CVn binaries.
Key words: binaries: close / methods: numerical / stars: evolution / white dwarfs
© The Authors 2023
 Open Access article, published by EDP Sciences, under the terms of the Creative Commons Attribution License (https://creativecommons.org/licenses/by/4.0), which permits unrestricted use, distribution, and reproduction in any medium, provided the original work is properly cited.
This article is published in open access under the Subscribe to Open model. This email address is being protected from spambots. You need JavaScript enabled to view it. to support open access publication.
1. Introduction
AM CVn binaries are ultra-compact (orbital periods in the range of ∼5 − 65 min) interacting binaries in which a white dwarf accretes helium-dominated material with undetectable amounts of hydrogen from a semi-degenerate or degenerate donor (e.g. Solheim 2010; Ramsay et al. 2018; Green et al. 2018b; van Roestel et al. 2022). AM CVn binaries deserve special attention for several reasons.
First, thanks to their short orbital periods AM CVn binaries are significant sources of low-frequency gravitational waves to be detected by space-based gravitational wave observatories. In particular, it is expected that hundreds of such systems will be detectable by the Laser Interferometer Space Antenna (LISA) satellite (Amaro-Seoane et al. 2017, 2023), which makes them ideal targets for the performance validation of this satellite (Kupfer et al. 2018). Second, AM CVn binaries may produce thermonuclear supernovae (Bildsten et al. 2007) which are among the most important explosions in the Universe. Third, very recently the first magnetic white dwarfs in AM CVn binaries have been identified (Maccarone et al. 2023), which may provide key constraints on models aiming at explaining the origin and evolution of white dwarf magnetic fields (e.g. Schreiber et al. 2021). Unfortunately, despite their relevance for several areas of modern astrophysics, current theories struggle to reliably predict the formation rates and characteristics of AM CVn binaries.
The formation of an AM CVn binary requires at least two episodes of Roche-lobe mass transfer, one to form the accreting white dwarf and another one to form the donor (e.g. Belloni & Schreiber 2023). The resulting formation channels have been summarised by Solheim (2010). In the white dwarf channel (e.g. Deloye et al. 2007; Wong & Bildsten 2021), a detached double white dwarf is formed first, and due to orbital angular momentum loss through gravitational wave radiation the orbit shrinks until eventually the less massive and bigger helium-core white dwarf fills its Roche lobe which causes the system to become an AM CVn binary. In the helium star channel (e.g. Yungelson 2008; Heinke et al. 2013; Wang et al. 2021; Bauer & Kupfer 2021), a detached binary hosting a white dwarf and a helium star is the direct progenitor of AM CVn binaries. If the lifetime of the helium star is sufficiently long, gravitational wave radiation will be strong enough to bring the helium star into contact with its Roche lobe resulting in an AM CVn binary. In both these formation channels, the last episode of Roche-lobe mass transfer has to be common-envelope (CE) evolution.
In contrast, in the third formation channel, the so-called cataclysmic variable (CV) channel (e.g. Tutukov et al. 1985; Podsiadlowski et al. 2003; Liu et al. 2021; Sarkar et al. 2023b), the last episode of mass transfer leading to the formation of AM CVn binaries is dynamically stable. CE evolution leads to the formation of a pre-CV, that is, a detached binary consisting of a white dwarf with a main sequence (or slightly evolved) companion star, which evolves towards shorter orbital periods mainly due to orbital angular momentum loss through magnetic braking. When the white dwarf companion fills its Roche lobe, the last episode of mass transfer begins. If this mass transfer is dynamically stable, the binary becomes a CV, that is, a white dwarf stably accreting hydrogen-dominated material from a main sequence (or slightly evolved) donor star (Warner 1995; Pala et al. 2020). If the donor star is slightly evolved, the donor star slowly loses its hydrogen envelope and may convert into a (semi-)degenerate helium-rich donor during the subsequent evolution. It is currently unclear which of the above-mentioned formation channels of AM CVn binaries is the dominant one (if any).
Towards a better understanding of the formation of AM CVn binaries, it is reasonable to take a closer look at recent observational constraints. Let’s start with the probably closest relatives to AM CVn binaries, so-called helium CVs (He CVs). In contrast to AM CVn binaries, in these systems the accreted helium-rich material still contains enough hydrogen to be detected in their spectra (e.g. Breedt et al. 2012; Green et al. 2020). The donor stars in He CVs have masses typically below 0.1 M⊙. The formation of He CVs is much less uncertain than that of AM CVn binaries. As He CVs have donors with a non-negligible surface hydrogen abundance, CE evolution as the last episode of mass transfer can be ruled out. This leaves as the only possible pathway the CV channel, that is, He CVs can be considered to be direct descendants from CVs.
This finding is complemented by the recent observational identification of CVs currently making the transition from hydrogen-dominated to helium-dominated accretion regimes (e.g. Green et al. 2020; Lee et al. 2022; Burdge et al. 2022, and references therein). These so-called transitional CVs contain a white dwarf accreting helium-rich material from a donor that is more massive (i.e. in the range of ∼0.1 − 0.2 M⊙) than those of He CVs. Otherwise these systems are quite similar to He CVs, that is, they have orbital periods shorter than ∼65 min and show both helium and hydrogen lines. Transitional CVs and He CVs may provide an evolutionary link between CVs and AM CVn binaries. Transitional CVs are expected to evolve towards shorter orbital periods until the envelopes of their donor stars are hydrogen exhausted and supported by electron degeneracy pressure. From this point on they will evolve towards longer orbital periods, appearing first as He CVs and then quickly turn into AM CVn binaries.
The existence of He CVs and transitional CVs supports the CV channel for the formation of AM CVn binaries. Additional evidence for this channel to potentially play a major role has been provided by a recent observational study of CVs hosting nuclear evolved donors (El-Badry et al. 2021). This work tripled the number of known CVs with evolved donors and estimates a birth rate roughly consistent with that of AM CVn binaries. El-Badry et al. (2021) therefore concluded that the CV channel may contribute significantly to the formation of AM CVn binaries.
As final evidence for the CV channel, we mention observational facts that are difficult to explain with the alternative channels for AM CVn binary formation. The current sample of eclipsing AM CVn binaries with reliable mass and radius measurements (van Roestel et al. 2022, their Table 8) contains two systems, Gaia14aae and ZTF J1637+49, with donors that are significantly bigger than typical AM CVn binary donors of the same mass (Green et al. 2020). These larger radii resemble those of He CV donors and might be naturally explained in the context of the CV channel while it appears rather challenging to understand their formation through the white dwarf and the helium star channels. In general, the properties of donors belonging to AM CVn binaries with orbital periods longer than ∼50 min are difficult to explain with the white dwarf and helium star channels. This is because irrespective of whether the donor is initially a helium-core white dwarf or a helium star, it will eventually cool and contract during the evolution before reaching such long orbital periods. To sum up, recently obtained observational constraints support that not only He CVs but also transitional CVs and AM CVn binaries might originate in large numbers from CVs.
In stark contrast to this recent observational evidence, for a long time the CV channel has been considered to be insignificant for the formation of AM CVn binaries, mainly because of two reasons that are based on the theoretical modelling of the CV channel. First, previous calculations (e.g. Goliasch & Nelson 2015; Kalomeni et al. 2016) predicted that AM CVn binaries are only formed from a very narrow range of the parameter space of initial post-CE binaries, which implies that AM CVn binaries should be much rarer than they actually are if this channel contributed significantly to their formation. It is worth noting that a similar argument has been used in the context of the formation of close detached millisecond pulsars orbiting helium-core white dwarfs. For these systems it also has been found that only a small range of initial parameters can lead to their formation (Istrate et al. 2014). Second, previous evolutionary models suggested that the CV channel always predicts AM CVn binaries to have detectable amounts of hydrogen in their atmospheres (e.g. Nelemans et al. 2010). Given that AM CVn binaries lack hydrogen in their spectra, the classical conclusion was that the CV channel should not significantly contribute to the intrinsic population of AM CVn binaries.
However, the two arguments against the formation of AM CVn binaries through the CV channel only hold when relatively weak magnetic braking is assumed to drive CV evolution. Interestingly, in the case of the just mentioned millisecond pulsar binaries, it has recently been shown that orbital angular momentum loss due to sufficiently strong magnetic braking can solve the previously identified fine-tuning problem (e.g. Chen et al. 2021; Deng et al. 2021). Given that also for the CV channel a dependence of the number of CVs with evolved donors turning into AM CVn binaries on the assumed magnetic braking prescription has been noted (Podsiadlowski et al. 2003; Liu et al. 2021; Sarkar et al. 2023b), one might speculate that the fine-tuning problem associated with the CV channel for AM CVn binaries could also be solved by assuming stronger magnetic braking. This is simply because the stronger the magnetic braking, the longer the maximum initial post-CE binary orbital period that still leads to convergent evolution (i.e. the binary evolves towards shorter orbital periods). Stronger magnetic braking might also solve the problem of the predicted detectability of hydrogen in AM CVn binaries as it may drive convergent CV evolution for more nuclear evolved donors, which may lead to more hydrogen-deficient degenerate donors.
We here revisit theoretical predictions of the CV channel adopting the CARB model for magnetic braking (Van & Ivanova 2019), which leads to sufficiently high orbital angular momentum loss rates. The main difference between the CARB and previously proposed prescriptions for magnetic braking is that instead of representing a rather empirical prescription, magnetic braking according to the CARB model is obtained in a self-consistent physical way, considering wind mass loss, the dependence of the magnetic field strength on the outer convective zone and the dependence of the Alfvén radius on the donor spin. The main motivation for the development of this magnetic braking model was to explain persistent low-mass X-ray binaries and ultra-compact X-ray binaries, which is virtually impossible with other prescriptions for magnetic braking (Van et al. 2019; Deng et al. 2021). Most importantly for the topic of this paper, the CARB prescription for magnetic braking has also proven to be successful in explaining several types of objects that experience a similar evolution as the one we investigate here (e.g. Soethe & Kepler 2021).
We indeed find that sufficiently strong magnetic braking can overcome the frequently mentioned difficulties of the CV channel. We show that if magnetic braking is as strong as that predicted by the CARB model, CVs hosting more nuclear evolved donors can still evolve into AM CVn binaries. Furthermore, except for AM CVn itself, all AM CVn binaries with reliable stellar and binary parameters can be explained in the context of the CV channel, especially the ‘problematic’ ones hosting oversized donors at long orbital periods, namely Gaia14aae and ZTF J1637+49.
2. Methodology
We used the MESA code (Paxton et al. 2011, 2013, 2015, 2018, 2019; Jermyn et al. 2023, r15140) to compute the evolution of CVs and their descendants. The MESA equation of state is a blend of the OPAL (Rogers & Nayfonov 2002), SCVH (Saumon et al. 1995), FreeEOS (Irwin 2004), HELM (Timmes & Swesty 2000), PC (Potekhin & Chabrier 2010) and Skye (Jermyn et al. 2021) equations of state. Nuclear reaction rates are a combination of rates from NACRE (Angulo et al. 1999), JINA REACLIB (Cyburt et al. 2010), plus additional tabulated weak reaction rates (Fuller et al. 1985; Oda et al. 1994; Langanke & Martínez-Pinedo 2000). Screening is included via the prescription of Chugunov et al. (2007) and thermal neutrino loss rates are from Itoh et al. (1996). Electron conduction opacities are from Cassisi et al. (2007) and radiative opacities are primarily from OPAL (Iglesias & Rogers 1993, 1996), with high-temperature Compton-scattering dominated regime calculated using the equations of Buchler & Yueh (1976). In what follows, we describe in detail the assumptions for stellar and binary evolution as well as the setup of our grid of models and the observational sample we compare the model predictions with.
2.1. Stellar evolution assumptions
For low-temperatures the MESA code offers two options for the radiative opacities, those from Ferguson et al. (2005) and those from Freedman et al. (2008, 2014). As we investigated systems that can reach very low temperatures (≲1000 K), we adopted the latter as they cover significantly lower temperatures than the former. However, we checked the influence of our selection by also running a set of models with opacities from Ferguson et al. (2005). The results of this exercise are described in Sect. 4.4.
We adopted two schemes for the boundary conditions of the atmosphere, both of which are described in Paxton et al. (2011, their Sect. 5.3). Most of the time we assumed the grey Eddington T(tau) relation to calculate the outer boundary conditions. However, in case the hydrogen envelope was entirely consumed, we switched to non-grey model atmosphere tables, which determine the surface temperature and pressure at the surface optical depth of one. We adopted a varying opacity consistent with the local temperature and pressure throughout the atmosphere. We further checked the influence of how opacities are calculated throughout the atmosphere by running a set of models using a uniform opacity that is iterated to be consistent with the final surface temperature and pressure at the base of the atmosphere. The results of this exercise are also described in Sect. 4.4.
We took into account exponential diffusive overshooting on the main sequence in case the star has a convective core. More specifically, we incorporated overshooting for stars initially more massive than 1.1 M⊙ with a smooth transition in the range 1.1 − 1.2 M⊙. We assumed that the extent of the overshoot region corresponds to 0.016 Hp (e.g. Schaller et al. 1992; Freytag et al. 1996; Herwig 2000), with Hp being the pressure scale height at the convective boundary.
We further used the nuclear network cno_extras.net, which accounts for carbon-nitrogen-oxygen burning. Convective regions were treated using the Henyey et al. (1965) modification of the mixing-length theory assuming that the mixing length is 2 Hp. For mass loss through winds we adopted the well-known Reimers (1975) prescription, setting the wind efficiency parameter to 0.5, which is consistent with metallicity-independent estimates derived from star cluster red giants (McDonald & Zijlstra 2015). Finally, we assumed solar metallicity (i.e. Z = 0.02) and set all other MESA parameters for stellar evolution to their default values.
2.2. Binary evolution assumptions
We applied orbital angular momentum loss due to gravitational wave radiation as well as magnetic braking. For the latter we adopted the CARB prescription as implemented in MESA by Van & Ivanova (20191), which is given by
![Mathematical equation: $$ \begin{aligned} \dot{J}_{\rm MB} =&-2\times 10^{-6} \left(\frac{-\dot{M}_{\rm wind}}{\mathrm{g\,s}^{-1}}\right)^{-1/3} \left(\frac{R}{\mathrm{cm}}\right)^{14/3} \left(\frac{\Omega }{\Omega _\odot }\right)^{11/3}\nonumber \\&\times \left(\frac{\tau _{\rm conv}}{\tau _{\odot ,\mathrm{conv}}}\right)^{8/3} \left[\left(\frac{v_{\rm esc}}{\mathrm{cm\,s}^{-1}}\right)^2 + \frac{2}{K_2^2}\, \left(\frac{\Omega }{\mathrm{s}^{-1}}\right)^2 \left(\frac{R}{\mathrm{cm}} \right)^2\right]^{-2/3} \end{aligned} $$](/articles/aa/full_html/2023/10/aa47047-23/aa47047-23-eq1.gif) (1)
(1)
where Ṁwind, R, Ω, τconv are the wind mass-loss rate, radius, spin, and convective turnover timescale of the companion of the white dwarf, respectively. The convective turnover timescale was calculated by integrating the inverse of the velocity of convective cells, as given by the mixing-length theory, over the radial extent of the convective envelope. The Sun spin and convective turnover timescale are 3 × 10⁻⁶ s−1 and 2.8 × 10⁶ s, respectively, and K2 = 0.07. Finally, vesc is the escape velocity.
Magnetic braking was assumed to contribute to the orbital angular momentum loss as long as a non-negligible convective envelope and a non-negligible radiative core are present. If the mass of the convective envelope decreased to less than two percent of the entire donor mass, we reduced the strength of magnetic braking by a factor e1 − 0.02/qconv (Podsiadlowski et al. 2002), where qconv is the mass fraction of the convective envelope. This approach takes into account that donors with a very small convective envelope do not develop strong magnetic fields and will in turn experience little magnetic braking.
In order to calculate evolutionary tracks of CVs, it is fundamental to consider the different regimes of mass transfer. Depending on the mass transfer rate and in turn the mass accretion rate onto the white dwarf, hydrogen shell burning on the white dwarf can be stable or unstable (e.g. Shen & Bildsten 2007; Nomoto et al. 2007). In case the mass accretion rate is lower than the limit for stable hydrogen burning, nova eruptions occur (unstable hydrogen burning) and mass transfer is highly non-conservative. Consistent with simulations of nova cycles (e.g. Yaron et al. 2005), we assumed that the entire accreted mass is expelled during nova cycles, carrying away the white dwarf specific orbital angular momentum. If the mass transfer rate exceeds a critical value, we expect stable hydrogen burning in a shell and mass transfer can be highly conservative. We assumed, in this case, mass transfer to be fully conservative, that is, we assumed that all the accreted mass remains on the white dwarf. To determine the critical rate separating stable and unstable hydrogen burning, we adopted the criterion from Wolf et al. (2013, their Fig. 1).
If the accretion rate significantly exceeds the value required for stable hydrogen burning, the star evolves into a giant-like structure and the accretion rate is limited by the core mass-luminosity relation, which defines an upper limit for stable hydrogen burning (see Wolf et al. 2013, for more details). If the mass transfer rate exceeds this upper limit, we assumed a maximum rate of stable hydrogen burning and that the remaining non-accreted matter will form a red-giant-like envelope that is eventually lost due to strong winds (Hachisu et al. 1996). We adopted the criterion from Wolf et al. (2013, their Fig. 1) to determine this upper limit. This procedure is especially important if the mass ratio between the donor and the white dwarf is large enough and/or the donor is already substantially evolved at the onset of mass transfer as in these cases the white dwarf mass can significantly grow during early CV evolution.
More accurately, we should adopt different critical values when the transferred material becomes helium-rich. In this case, the critical values are higher than those adopted in this work (e.g. Wang 2018), with the limit for stable helium burning being typically higher than ∼5 × 10⁻⁶ M⊙ yr−1. Such high rates are never reached in our calculations during accretion of helium-rich material. While the mass acretion rate can be larger than the smaller critical values that we adopted in this work, this occurs only for a very short amount of time (≲0.2 Myr), which implies that the mass growth we predict during this phase is negligible (≲3%, corresponding to a few 0.01 M⊙) and, in turn, that our results are not affected by this.
We set all other MESA parameters for binary evolution to their default values.
2.3. Initial post-CE conditions and post-CE evolution
We started all our simulations immediately after white dwarf formation, that is, we assume as initial configuration a post-CE detached binary consisting of a point-mass white dwarf and a zero-age main-sequence star. Throughout this paper we use the term ‘initial post-CE binary’ to refer to these initial conditions of our simulations. The initial parameters of the post-CE binaries covered white dwarf masses from 0.4 to 1.0 M⊙, companion masses from 1.0 to 1.5 M⊙, and orbital periods ranging from ∼0.25 to ∼5 d.
We assumed that the orbits of post-CE binaries circularised during CE evolution which is in agreement with observations of large samples of post-CE binaries (Nebot Gómez-Morán et al. 2011; Hernandez et al. 2021, 2022a,b; Zorotovic & Schreiber 2022). Finally, the companion was assumed to leave CE evolution synchronised with the orbital motion, which means magnetic braking was allowed to extract orbital angular momentum right from the start of the simulations (as long as the other conditions for magnetic braking, such as the presence of a convective envelope and a radiative core, were satisfied). We then computed the evolution of different CVs by varying the initial post-CE binary masses and orbital periods. We are aware of the fact that the evolution prior to CE evolution was not taken into account in our simulations. To include this part of the evolution would require to simulate the formation of the white dwarfs which is beyond the scope of the present investigation but will be addressed in a follow-up publication.
To be considered as a potential progenitor of a He CV or an AM CVn binary in our simulations, we requested that the donor star has at least a non-negligible helium core (≥0.01 M⊙) at the onset of mass transfer. Otherwise, the system is treated as a “standard” CV and its evolution was no longer taken into account. Donors with relatively massive helium cores at the onset of mass transfer will likely evolve to CE evolution, followed by a merger. We imposed a critical mass transfer rate of 10−4 M⊙ yr−1, above which we assumed that mass transfer is or will become dynamically unstable and consequently discarded systems that reached this value. Finally, we stopped all simulations when either the donor age exceeded the Hubble time (≈13.7 Gyr), or its mass dropped below 0.01 M⊙. The former choice is because this corresponds to the maximum age a system is expected to have, while the latter choice is motivated by the lowest values of the donor mass in AM CVn binaries derived from observations.
We considered as a He CV or an AM CVn binary only those CVs that at some point during their evolution reach orbital periods below ∼60 min. Albeit there is no clear overall distinction between AM CVn binaries and He CVs that could be applied to all systems (e.g. Nasser et al. 2001; Nagel et al. 2009; Green et al. 2019), we separated them adopting a critical surface hydrogen mass fraction of 10−4 based on the upper limits estimated by Green et al. (2019) for Gaia14aae. Systems having surface hydrogen abundances lower than that were considered AM CVn binaries, and systems exceeding this critical value were referred to as He CVs.
2.4. Observational samples
To verify whether our evolutionary tracks can reproduce observed samples of AM CVn binaries we compared them with observational samples of systems corresponding to different evolutionary stages during post-CE binary evolution.
For the observational sample of CVs we considered systems hosting nuclear evolved donors, which can be easily identified by their much larger donors when compared to an unevolved main-sequence star and from their enhanced N V/C IV line flux ratios (but see also the discussion in Sparks & Sion 2021). We excluded systems for which only estimates or upper limits for the mass ratio are provided in the literature. This left us with the systems V1309 Ori (Staude et al. 2001), EY Cygni (Echevarría et al. 2007), AE Aqr (Echevarría et al. 2008), HS 0218+3229 (Rodríguez-Gil et al. 2009), KIC 5608384 (Yu et al. 2019), V1460 Her (Ashley et al. 2020), CXOGBS J175553.2–281633 (Gomez et al. 2021), 1RXH J082623.6–505741 (Sokolovsky et al. 2022), and SWIFT J183221.5–162724 (Beuermann et al. 2022). In addition, we included the ‘terminal’ CVs discovered by El-Badry et al. (2021), which host nuclear evolved but fairly low-mass donors. In the majority of these systems, mass transfer is still ongoing, as indicated by weak emission lines, eclipses of the donor by an accretion disk, and irregular variations in brightness. The remaining systems have recently detached, with donors being proto-white dwarfs that nearly fill their Roche lobes.
Among all observed AM CVn binaries, we consider only those that are either eclipsing or have mass ratios derived from spectroscopy, as we consider the derived parameters in these cases to be more reliable. The well-characterized eclipsing systems that we include are YZ LMi (Copperwheat et al. 2011), Gaia14aae (Green et al. 2018b), and the five Zwicky Transient Facility (ZTF) systems discovered by van Roestel et al. (2022), namely ZTF J1637+49, ZTF J0003+14, ZTF J0220+21, ZTF J2252–05, and ZTF J0407–00. Systems with mass ratios derived from spectroscopy are GP Com (Marsh 1999), SDSS J1240–0159 (Roelofs et al. 2005), AM CVn itself (Roelofs et al. 2006), and V396 Hya (Kupfer et al. 2016). For the last four systems, only the orbital period and mass ratio has been determined from observations. We therefore used the estimates by Green et al. (2018a) for the radii and masses of the donors. There are several other observed AM CVn binaries with mass ratio estimated from the superhump excess-mass ratio relation. Even though this procedure seems to work reasonably well for CVs, it is not yet clear whether this approach leads to accurate estimates or not when applied to AM CVn binaries (e.g. Roelofs et al. 2006; Green et al. 2018a). For this reason, we did not consider these systems.
For none of the currently known He CVs parameters have been derived from eclipses or spectroscopy, as highlighted by Green et al. (2020). For these systems, the mass ratio was derived from the superhump excess–mass ratio relation. To avoid excluding these important systems from our study, we consider them here but draw the readers’ attention to the fact that the estimated properties are not necessarily reliable. The systems we consider are CRTS J1740+4147 (Imada et al. 2018), CRTS J1122–1110 (Breedt et al. 2012) and CRTS J1111+5712 (Littlefield et al. 2013). For these three systems, we took the values of the donor mass and the donor radius estimated by Green et al. (2020).
Finally, regarding transitional CVs, there is only one that is eclipsing with measured parameters, that is, ZTF J1813+4251 discovered by Burdge et al. (2022). The remaining systems have properties estimated from superhump excess, except for V485 Cen, whose mass ratio was derived from spectroscopy (Augusteijn et al. 1996). To include more systems of this class, we considered not only ZTF J1813+4251 and V485 Cen but also the systems CRTS J1028–0819 (Woudt et al. 2012) and EI Psc (Thorstensen et al. 2002). We used the parameters derived by Burdge et al. (2022) for ZTF J1813+4251, while we took the masses and radii of the donors estimated by Green et al. (2020) for the other systems.
3. Cataclysmic variable evolution revisited
We start the presentation of our results by revisiting CV evolution. In case the donor star is not evolved and assuming the often used prescription of disrupted magnetic braking based on Rappaport et al. (1983) one obtains standard evolutionary tracks for CV evolution (e.g. Knigge et al. 2011; Schreiber et al. 2016; Belloni et al. 2018, 2020; Pala et al. 2020, 2022), an example of which is given by the long-dashed red lines in Fig. 1 (extracted from Belloni & Schreiber 2023). For this evolutionary track we assumed a post-CE orbital period, white dwarf mass and companion mass of 0.5 d, 0.8 and 0.8 M⊙, respectively.
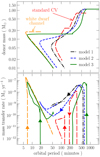 |
Fig. 1. Evolution of donor mass (top panel) and mass transfer rate (bottom panel) as a function of orbital period obtained adopting the CARB model for magnetic braking. We show the evolution of three illustrative CVs with initial post-CE white dwarf and donor star masses of 0.8 and 1.1 M⊙, respectively. The initial post-CE orbital periods and donor helium core mass at the onset of mass transfer are different in each evolutionary track and are given by the following values: model 1: 2.20 d and ≈0.043 M⊙ (dot-dashed black lines), model 2: 2.34 d and ≈0.068 M⊙ (short-dashed blue lines), and model 3: 2.60 d and ≈0.105 M⊙ (solid green lines). On top of that, we also show an example of standard CV evolutionary sequence (long-dashed red lines, from Belloni & Schreiber 2023) and an example of evolutionary sequence for the white dwarf channel (long-dashed orange lines, from Wong & Bildsten 2021). The arrows in the bottom panel were added for clarity and indicate the direction of the evolution. The tracks for which the orbital period minimum is below 20 min correspond to CV evolution leading to the formation of AM CVn binaries. Model 3 represents a mixed channel in which a CV leads to a close detached double white dwarf binary that latter becomes an AM CVn binary. The final evolution of this system is similar to the white dwarf channel for AM CVn binary formation. See text for more details. |
In brief, following the onset of mass transfer, the partially convective donor is driven out of thermal equilibrium and expands in response to mass loss due to sufficiently high orbital angular momentum loss through magnetic braking. The donor is nevertheless able to reach thermal equilibrium, but with a radius that is larger than expected for its mass. The CV remains in a semi-detached configuration until the donor becomes fully convective, at an orbital period of ≈3 h. At this moment, magnetic braking becomes significantly weaker (Schreiber et al. 2010; Zorotovic et al. 2016), probably because of a rise in the donor magnetic field complexity (e.g. Taam & Spruit 1989; Garraffo et al. 2018). As a consequence of the strongly reduced orbital angular momentum loss rate, the donor can relax towards its thermal equilibrium, shrinks to its normal size and loses contact with its Roche lobe, and the system becomes a detached binary. After the remaining orbital angular momentum loss mechanisms have sufficiently shortened the orbital period, mass transfer starts again at a lower rate at an orbital period of ≈2 h. The detached phase in the period range of ≈2 − 3 h is the standard explanation for the observed orbital period gap.
The situation changes for evolved donor stars. In this case, the detached phase producing the orbital period gap is not expected as the donor does not become fully convective. However, CV evolution with evolved donors may include a detached phase caused by a different effect. If the donor is sufficiently evolved, its envelope might become radiative which should suppress magnetic braking. As the evolutionary pathways of CVs with evolved donors have implications for the emerging AM CVn binaries, we now describe in detail both possibilities, that is, CV evolution and AM CVn binary formation with and without a detached phase.
3.1. Evolution with a detached phase
A standard condition required for efficient magnetic braking is the existence of a non-negligible convective envelope, a fact that is taken into account in the CARB model. Therefore, magnetic braking can be suppressed during the evolution of CVs with evolved donors in case the convective envelope becomes radiative. This occurs if the effective temperature of the donor exceeds a critical value (e.g. Belczynski et al. 2008), which corresponds to the convective/radiative envelope boundary for subgiants. This boundary is in general very broad (∼5000 − 8000 K) and the exact value varies from system to system, depending on stellar properties such as metallicity, mass, structure, outer boundary conditions and chemical profile. We provide more details about the donor effective temperature evolution in Sect. 3.3.
The transition from convective to radiative envelope occurs for sufficiently hot and nuclear evolved donors. An example for this evolution is given by model 3 in Fig. 1, which has been calculated assuming values 2.60 d, 0.8 and 1.1 M⊙ for the initial post-CE orbital period, white dwarf mass and donor mass, respectively. At the onset of mass transfer, which takes place 6.72 Gyr after CE evolution, the mass of the helium core of the donor is ≈0.105 M⊙ and the convective envelope of the donor corresponds to ≈13% of its mass. During early CV evolution, the fractional convective envelope mass of the donor increases, reaching a maximum of ≈24% when the donor mass is ≈0.49 M⊙, which happens ≈11 Myr after the onset of mass transfer. From this point on, the size of the convective envelope decreases as the donor mass decreases and consequently magnetic braking also drops which leads to a fast decrease in the mass transfer rate.
The convective envelope vanishes when the donor effective temperature is ≈8029 K at a donor mass of ≈0.151 M⊙ and an orbital period of ≈3.95 h, which happens ≈987 Myr after the onset of mass transfer. At this point, the mass of the helium core of the donor is ≈0.128 M⊙, which means it significantly increased during CV evolution (by ≈20%). Magnetic braking is then completely suppressed and further evolution is driven mainly by orbital angular momentum loss due to the emission of gravitational waves. As this orbital angular momentum loss mechanism is much weaker than magnetic braking, the donor is able to relax to its normal size causing it to detach from its Roche lobe and the system becomes a detached binary through very much the same mechanism that is supposed to cause the orbital period gap of CVs. Mass transfer resumes ≈3.26 Gyr after the donor star detached from its Roche-lobe at a very short orbital period of ≈19 min. At this point, the donor mass is ≈0.149 M⊙ and its helium core mass is ≈0.139 M⊙.
This detached phase is observationally supported by the results achieved by El-Badry et al. (2021) who found a group of CVs hosting highly consumed subgiant/red giant donors that either just have entered the detached phase or might be very close to it. Unlike CVs harbouring unevolved donors on the main sequence for which the detached phase starts and ends for all systems more or less at the same orbital period, for CVs with nuclear evolved donors the width of the detached phase is strongly dependent on the donor properties at the onset of mass transfer, mainly the helium core mass (compare the long-dashed red and solid green tracks in Fig. 1). We note that this detached phase has been used not only to explain observations of white dwarf binaries but also close detached millisecond pulsar binaries, which originate from low-mass X-ray binary evolution (e.g. Istrate et al. 2014; Chen et al. 2021; Soethe & Kepler 2021).
The longest phases of detached evolution occur when the mass of the helium core of the donor is relatively high (i.e. ≳0.14 M⊙) at the moment magnetic braking becomes inefficient. For these systems, mass transfer only resumes at around the orbital period minimum. However, although the mass of the hydrogen envelope is extremely low (i.e. ≲0.01 M⊙), it always has to be consumed before the system finally reaches the orbital period minimum. In these cases, the AM CVn binary formation pathway can be considered a mixture of the CV channel and the white dwarf channel. This is because after the mass transfer ceases, the binary simply consists of a white dwarf paired with a newly born extremely-low-mass white dwarf. Then, as in the white dwarf channel the orbit shrinks until the moment the extremely-low-mass white dwarf fills its Roche lobe at the onset of AM CVn binary evolution. In other words, an AM CVn binary can form through the white dwarf channel even when the donor was formed via an episode of dynamically stable mass transfer in the CV channel. Figure 1 shows that the final evolution of detached CVs with evolved donors can be very similar to the evolutionary sequence for the white dwarf channel computed by Wong & Bildsten (20212), corresponding to their model with initial accretor mass, donor mass and donor specific central entropy of, respectively, 0.75 M⊙, 0.18 M⊙ and 3.07 NAkB, where NA is Avogadro’s number and kB is the Boltzmann’s constant.
However, there is an important difference between the donors resulting from CV evolution and those having formed through CE evolution. In the white dwarf channel, the donor entropy is regulated by the double white dwarf formation history and initial post-CE properties (e.g. Deloye et al. 2007). In particular, for a given combination of initial post-CE accretor and donor masses the shorter the initial post-CE orbital period the higher the donor entropy at the onset of mass transfer. This holds irrespective of whether the donor was formed first or second during the pathway from a zero-age main-sequence binary to a double white dwarf binary. On the other hand, in the CV channel, when mass transfer resumes following the detached phase, the donor entropy is entirely determined by the helium core mass at the onset of CV evolution. This is because the upper and lower edges of the detached phase depend on the helium core mass at the onset of CV evolution. More specifically, the higher the helium core mass at the onset of CV evolution, the longer the orbital period corresponding to the upper edge of the detached phase, and in turn, the longer the time it takes gravitational wave radiation to bring the donor into contact with its Roche lobe again. This then implies that the higher the helium core mass at the onset of CV evolution, the lower the donor entropy and the more degenerate the donor when mass transfer resumes after the detached phase.
Another relevant difference is connected with the importance of magnetic braking when the donor star develops a non-negligible convective envelope during post-orbital-period-minimum evolution. In the classical white dwarf channel, the main driver of AM CVn binary evolution is always gravitational wave radiation. However, our model also allows a degenerate donor to lose orbital angular momentum owing to magnetic braking as long as it develops a non-negligible convective envelope. In our scenario, magnetic braking typically becomes relevant again, comparable to or stronger than gravitational wave radiation, as soon as the convective turnover timescale is sufficiently long. The transition from gravitational-wave-radiation-driven evolution to magnetic-braking-driven evolution takes place at different masses and different orbital periods, depending on the detailed structure of the donor after having passed the orbital period minimum. In general, the lower the helium core mass at the onset of mass transfer, the higher the donor mass and the shorter the orbital period at which magnetic braking starts to dominate again, which can be seen by comparing models 2 and 3 in Fig. 1. Our model therefore predicts different degrees of bloating for donor stars of AM CVn binaries, depending on their detailed structure at the onset of mass transfer.
Under certain conditions, magnetic braking may also turn on before the orbital period minimum, which happens for model 3 in Fig. 1. In general, the higher the helium core mass at the onset of the detached phase, the shorter the orbital period at which mass transfer resumes following the detached phase. This is a consequence of the relation between the helium core mass and structure of the donor, especially the radius. For CVs with donors having at the onset of the detached phase a moderate helium core mass (∼0.12 − 0.14 M⊙), mass transfer resumes at an orbital period significantly longer than the orbital period minimum. In this case the donor may cross the convective/radiative envelope boundary well before the orbital period minimum but magnetic braking is much weaker than gravitational wave radiation at this point of the evolution. Irrespective of whether a negligible fraction of angular momentum loss comes form magnetic braking the system evolves towards shorter orbital periods until the hydrogen envelope is entirely consumed. At this point, the system bounces and subsequently evolves towards longer orbital periods hosting a degenerate donor.
3.2. Evolution without a detached phase
A detached phase can be entirely suppressed when the donor is not sufficiently evolved, that is, when the helium core mass at the onset of mass transfer is ≲0.1 M⊙. This is illustrated in Fig. 1 by model 2 which was calculated assuming an initial post-CE orbital period of 2.34 d and a white dwarf mass and donor mass of 0.8 and 1.1 M⊙, respectively. In these cases, the donor never becomes hot enough to cross the convective/radiative envelope boundary, never detaches from its Roche lobe, and magnetic braking only becomes weaker as the donor mass decreases but never ceases. At some point, however, when the orbital period is sufficiently short, orbital angular momentum loss caused by the emission of gravitational waves becomes stronger than magnetic braking and drives the evolution towards the orbital period minimum.
For model 2 in Fig. 1, this transition occurs when the donor mass is ≈0.11 M⊙ at an orbital period of ≈55 min. As orbital angular momentum loss through magnetic braking further decreases but that through gravitational wave radiation increases towards shorter orbital periods, this transition corresponds to a minimum of the mass transfer rate. During the subsequent evolution, the mass transfer rate reaches a local maximum at the orbital period minimum (≈18 min for model 2) and afterwards decreases as the orbit expands due to the donors response to mass loss. As the donor further loses mass and changes its structure (the fractional convective envelope increases), at some point magnetic braking becomes stronger than gravitational wave radiation again, just as discussed in the previous section. The moment at which magnetic braking and gravitational wave radiation become comparable corresponds to a local minimum of the mass transfer rate because magnetic braking becomes stronger as the donor mass further decreases (and the orbital period increases). For this reason, AM CVn binaries predicted by the CV channel that follow this pathway (i.e. without a detached phase) have donors with a relatively high central entropy that are larger than expected for their mass. We will discuss in more detail the entropy and bloating of donors for cases lacking a detached phase in Sect. 4.3.
The last evolutionary pathway we discuss is related to CVs giving birth to He CVs without transitioning into AM CVn binaries at donor masses ≳0.01 M⊙, which is illustrated by model 1 in Fig. 1. This evolution corresponds to the case of the least nuclear evolved donors, that is, donors with low helium core masses (≲0.04 M⊙) at the onset of mass transfer. The evolution in these cases is similar to that of model 2, except that magnetic braking never becomes weaker than gravitational wave radiation. Throughout the evolution, the fractional mass of the convective envelope of the donor stays at a level of at least ∼20%, and for this reason magnetic braking remains efficient. This evolution also corresponds to the case of the highest donor entropies when the hydrogen envelope vanishes, leading to the largest donors with the lowest degree of degeneracy and longest orbital period minimum (≈45 min for model 1).
3.3. Rapid decrease in the donor radius before the orbital period minimum
The three models shown in Fig. 1 illustrate the impact of having a nuclear evolved donor at the onset of mass transfer on CV evolution. When the donor mass is ≳0.15 − 0.20 M⊙, the more evolved the donor at the onset of mass transfer, the larger its radius during the evolution, which implies that more evolved donors fill their Roche lobes at longer orbital periods. This is different to what is predicted for CVs hosting unevolved main-sequence donor stars at the onset of mass transfer, which follow a very tight evolutionary path as evidenced by the small scatter in the radius–mass relation of these donors (e.g. McAllister et al. 2019).
At donor masses ≲0.15 − 0.20 M⊙, the previously mentioned trend is reversed, that is, the more evolved the donor at the onset of mass transfer, the smaller the radius during the late evolution. This is a well-known feature during the evolution of interacting binaries hosting nuclear evolved donors (e.g. Tutukov et al. 1985; Fedorova & Ergma 1989; Ergma & Sarna 1996; Podsiadlowski et al. 2002; Nelson et al. 2004; Lin et al. 2011; Kalomeni et al. 2016; Van et al. 2019; Van & Ivanova 2019; Deng et al. 2021; Chen et al. 2021; El-Badry et al. 2021; D’Antona & Tailo 2022; Gossage et al. 2023; Yamaguchi et al. 2023).
How fast the radius decrease and the mass at which this starts to occur strongly depends on how nuclear evolved the donor was at the onset of mass transfer. The higher the mass of the helium core of the donor at the onset of mass transfer, the faster the radius decreases and the higher the mass at which this starts to happen. The donor effective temperature at some point stops to increase and starts again to decrease. The maximum effective temperature reached during the evolution also strongly depends on how nuclear evolved the donor was at the onset of mass transfer. The higher the mass of the helium core of the donor at the onset of mass transfer, the higher the maximum effective temperature that is reached during the rapid decrease in radius.
Figure 2 illustrates the above described processes in a Hertzsprung-Russell and mass–radius diagram. As the donor in model 1 is not sufficiently evolved at the onset of mass transfer, its luminosity and effective temperature monotonically decreases throughout the evolution. On the other hand, models 2 and 3 have sufficiently massive helium cores at the onset of mass transfer and for this reason at some point their radii start to decrease faster and the thin hydrogen envelope heats up. The effective temperatures of their donors then switch from slowly decreasing to significantly increasing. As mentioned in Sect. 3.1, the donor in model 3 is sufficiently evolved for its effective temperature to cross the convective/radiative envelope boundary, which causes magnetic braking to become inefficient and the system to enter a detached phase.
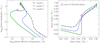 |
Fig. 2. Hertzsprung-Russell diagram (left panel) and mass–radius evolution (right panel) of the donors of the three models shown in Fig. 1, namely model 1 (dot-dashed black lines), model 2 (short-dashed blue lines) and model 3 (solid green lines). Following the onset of mass transfer, the donor luminosity, effective temperature and radius decrease. The radius of donors with relatively massive helium cores (≳0.05 M⊙) at the onset of mass transfer eventually starts to decrease faster during the evolution. In case the effective temperature reaches sufficiently high values, the convective envelope vanishes which causes magnetic braking to become inefficient and the donor to detach from its Roche-lobe (illustrated by the magenta circles for model 3). The more evolved the donor at the onset of mass transfer, the higher the donor mass at the moment the radius starts to decrease faster and the higher the maximum effective temperature reached during the evolution. |
The above-discussed processes have an impact on the evolution of the donor mass with the orbital period. As mentioned earlier, more nuclear evolved donors fill their Roche lobes at longer orbital periods, for masses ≳0.15 − 0.20 M⊙. However, due to the rapid decrease of the radius of those donors that are sufficiently evolved, at masses ≲0.15 − 0.20 M⊙, donors of the same mass are smaller when they originate from more nuclear evolved donors. Thus, the more nuclear evolved the donor at the onset of mass transfer, the smaller its radius at these masses. This implies that donors originating from more evolved donors fill their Roche lobes at shorter orbital periods at masses ≲0.15 − 0.2 M⊙ as shown in Fig. 1.
3.4. Surface chemical abundances of the donor
As outlined in the introduction, the predicted detectability of hydrogen is usually considered a major problem of the CV formation channel. We therefore show in Fig. 3 the evolution of the surface abundances of the donor stars around the orbital period minimum produced by the three models shown in Fig. 1. The donors in AM CVn binaries that evolved through a detached phase (e.g. model 3) very quickly (≲0.1 Myr) lose their hydrogen while bouncing at the orbital period minimum. Other elements also reach equilibrium at the orbital period minimum. There is thus no doubt that CVs can give birth to AM CVn binaries if their evolutionary pathway includes a detached phase, as no hydrogen would be detected in such systems during post-orbital-period-minimum evolution. A much more detailed discussion of the detectability of hydrogen in the systems predicted by our model is provided in Sect. 4.1.
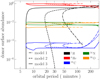 |
Fig. 3. Evolution around the orbital period minimum of the donor surface abundances (colour coded by elements) for the three models shown in Fig. 1, namely model 1 (dot-dashed lines), model 2 (short-dashed lines) and model 3 (solid lines). The hydrogen abundance quickly vanishes for model 3, which is similar to the white dwarf channel, when the system reaches the orbital period minimum. On the other hand, for model 2, the hydrogen drops to an undetectable level during early post-orbital-period-minimum evolution (between ≈20 and ≈30 min). Finally, the surface hydrogen abundance in model 1 remains high enough to be detected throughout its evolution. Meanwhile helium abundance is enhanced as the three models approach the orbital period minimum, and together with the other elements, quickly evolves towards equilibrium afterwards. That said, model 1 is a typical example of how CVs evolve to He CVs. More importantly, models 2 and 3 clearly illustrate that hydrogen is not necessarily visible in CV descendants, irrespective of the present-day orbital period. In addition, the surface abundances predicted for the two pathways leading to AM CVn binaries, that is, with (model 3) and without (model 2) a detached phase, are rather similar after hydrogen vanishes suggesting that it is very hard to distinguish between the white dwarf channel and the CV channel with respect to abundance ratios. |
One may wonder whether the evolutionary pathway without a detached phase can lead to the formation of AM CVn binaries, that is, whether hydrogen can eventually drop below detectable levels during post-orbital-period-minimum evolution. This can indeed happen as illustrated in Fig. 3. As these systems approach the orbital period minimum, the surface hydrogen abundance slightly decreases, while the surface helium abundance slightly increases and the surface abundances of other elements remain roughly constant. After the system bounces, the surface hydrogen abundance quickly (≲50 Myr) drops during early post-orbital-period-minimum evolution and can become undetectable. For model 2, this happens for orbital periods between ≈18 and ≈25 min and donor masses between ≈0.075 and ≈0.04 M⊙. For orbital periods ≳18 min and donor masses ≳0.04 M⊙, this system is a He CV, while for orbital periods ≳25 min and donor masses ≲0.04 M⊙, it is an AM CVn binary. Therefore, for model 2, at an orbital period of ≈25 min and a donor mass of ≈0.04 M⊙ the system converted from a He CV to an AM CVn binary. We will discuss this transition in more detail in Sect. 4.2.
The surface abundances of elements other than hydrogen remain in equilibrium, except for carbon which is initially enhanced and evolves towards equilibrium as hydrogen diminishes. Interestingly, the predicted surface abundances are very similar to those produced by evolutionary pathways that include a detached phase. In particular, we predict ratios between nitrogen and oxygen in the range ∼1 − 7, between nitrogen and carbon in the range ∼113 − 220, and between oxygen and carbon in the range ∼16 − 130. This indicates that it will be hard to distinguish between the detached CV channel and the typical CV channel based solely on the chemical composition.
Finally, when the donor is only slightly nuclear evolved at the onset of mass transfer, the overall surface hydrogen abundance remains high throughout the evolution as shown in Fig. 3. For model 1, the surface abundances evolve similar to those of model 2, except for hydrogen. The timescale for hydrogen disappearance is much longer than for the other two models. In other words, albeit the surface hydrogen abundance drops during post-orbital-period-minimum evolution, this effect is just not strong enough for hydrogen to become undetectable. Such systems therefore appear as He CVs for most of their post-orbital-period-minimum evolution, likely becoming AM CVn binaries only when their donors reach very low masses (comparable to that of planets).
4. Towards solving the problems of the cataclysmic variable channel
After this brief overview on how CVs can evolve into AM CVn binaries if the CARB model for magnetic braking is assumed, we turn now to discussing the frequently mentioned problems of the CV formation channel that were highlighted in the introduction. We start with the absence of hydrogen lines in the observed spectra of AM CVn binaries, and subsequently address the fine-tuning problem.
4.1. Solving the first problem: lack of visible hydrogen
To evaluate the conditions under which the CV channel leads to the formation of AM CVn binaries with undetectable amounts of hydrogen, we calculated evolutionary tracks for fixed masses of the initial post-CE binaries, that is, a white dwarf mass of 0.8 M⊙ and a companion of mass of 1.1 M⊙, and varied the initial post-CE orbital period from 1.98 to 3.00 d. The resulting evolutionary tracks are shown in Fig. 4. In both panels, the colours indicate the log-scaled surface hydrogen abundance during the evolution. On top of the evolutionary tracks we included the observational samples, as described in Sect. 2.4, corresponding to CVs hosting nuclear evolved donors, transitional CVs, He CVs, and AM CVn binaries.
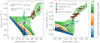 |
Fig. 4. Convergent CV evolution when the CARB model for magnetic braking is adopted for different initial post-CE binaries. The colour represents the log-scaled surface hydrogen abundance of the donor. Systems can be considered as AM CVn binaries if they reach shades of blue. Related objects, that is, CVs, transitional CVs, and He CVs are indicated by shades of other colours. While the assumed initial post-CE orbital periods cover values from 1.98 to 3.00 d, we fixed the initial post-CE white dwarf mass to 0.8 M⊙ and the initial post-CE companion mass to 1.1 M⊙. The evolution of the surface hydrogen abundance is strongly dependent on the mass of the helium core at the onset of mass transfer: the more massive the helium core, the lower the surface hydrogen abundance at a given orbital period during post-orbital-period-minimum evolution. CVs with donors having initially less massive helium cores bounce at longer orbital periods, leading to more massive and larger donors during AM CVn binary evolution. Along with the evolutionary tracks we included the following observed systems: CVs harbouring nuclear evolved donors (red diamonds), transitional CVs (cyan circles), He CVs (magenta squares), and AM CVn binaries (yellow stars), as described in Sect. 2.4. Except for AM CVn itself, the one with largest donor mass among AM CVn binaries, the characteristics of all AM CVn binaries can be explained by the CV channel, which means that the lack of hydrogen lines in the optical spectra of AM CVn binaries cannot be easily used as an argument against the CV formation channel. See Sect. 4.1 for more details. |
The evolution predicted for CVs with evolved donors at orbital periods longer than ∼80 min agrees well with the location of the observed CVs harbouring nuclear evolved donors. The predicted orbital period during this early evolution as well as the donor radii depend strongly on the donor structure at the onset of mass transfer, in particular on its radius and helium core mass. The shorter the initial post-CE orbital period, the sooner the donor fills its Roche lobe, and consequently the smaller its radius and the lower its helium core mass. For this reason the orbital periods at the onset of mass transfer are shorter for less nuclear evolved donors, which have less massive helium cores.
As described in Sect. 3, the subsequent evolution can be divided into two different pathways, either with a detached phase or without it. Irrespective of whether one case or the other happens, the systems will evolve towards shorter orbital periods until they reach the orbital period minimum and start bouncing. The precise value of the orbital period minimum depends on the donor properties, mainly the mass of its helium core at the onset of mass transfer: the lower the helium core mass, the longer the orbital period minimum. For donors with extremely-low-mass helium cores, the minimum orbital period can be as long as ∼3 h. On the other hand, for those having the highest helium core masses, the orbital period minimum can be as short as ∼5 min.
For CVs that evolve through a detached phase, the upper edge and the lower edge and thus the width of the detached phase depend strongly on the helium core mass of the donor at the onset of the first mass transfer phase. The more massive the helium core of the donor, the longer the detached phase, and in turn the longer (shorter) is the upper (lower) edge of the detached phase. In terms of donor entropy and degree of degeneracy, this implies that donors with higher helium core masses at the onset of mass transfer have more time to relax, cool and become more degenerate before mass transfer resumes after the detached phase. For this reason, the end of the detached phase corresponds to very short orbital periods in these cases. On the other hand, donors in CVs with continuous mass transfer (i.e. no detached phase) keep their high entropy and remain bloated even during post-orbital-period-minimum evolution. For these systems, the higher the helium core mass of the donor, the lower the entropy (especially near the centre) and for this reason the shorter the orbital period minimum. The formation of systems like Gaia14aae and ZTF J1637+49 can be explained through this channel as should be discussed in more detail in Sects. 4.2 and 4.3.
Combining these different tracks implies that at a given orbital period the predicted surface hydrogen abundance is varying substantially during the post-orbital-period-minimum evolution. The shorter the orbital period minimum, the lower the surface hydrogen abundance at a given orbital period. This is a direct consequence of the chemical profile of the donor at the onset of mass transfer, which is different in all evolutionary tracks shown in Fig. 4. Except for AM CVn itself, the CV channel can explain all the AM CVn binaries with reliable parameters as shown in Fig. 4 since the surface hydrogen abundance drops to undetectable levels in the evolutionary tracks passing through them. One important consequence of the CV channel which agrees with the observations is that donors can be substantially larger for their masses in comparison to the white dwarf channel. This is because of the high entropy of the donor during post-orbital-period-minimum evolution due to magnetic braking, which keeps the orbital-angular-momentum-loss timescale much shorter than the thermal timescale of the donor.
To show that the formation channel of AM CVn binaries from CVs as outlined above does not represent a rare and unlikely evolutionary pathway, we compare the ranges of initial orbital periods of post-CE binaries leading to the formation of He CVs and AM CVn binaries. The initial post-CE masses for the tracks shown in Fig. 4 are fixed to 0.8 (white dwarf) and 1.1 M⊙ (donor). Binaries with initial post-CE orbital periods from ≈2.14 to ≈2.25 d evolve to He CVs and remain as He CVs at a donor mass as low as 0.01 M⊙, while those with orbital periods from ≈2.25 to ≈2.64 d first evolve to He CVs and subsequently evolve to AM CVn binaries at a donor mass ≳0.01 M⊙. More details about this transition from He CVs to AM CVn binaries are provided in Sect. 4.2. The range of orbital periods leading to AM CVn binaries is thus broader than that leading to He CVs.
This result does not depend on the exact value of the initial post-CE masses. Assuming, for example, post-CE binaries hosting initially a white dwarf mass of 0.8 M⊙ but paired with a companion of mass 1.0 M⊙, the range of initial post-CE orbital periods leading to He CVs and subsequently AM CVn binaries remains larger than that producing He CVs that remain as such at donor masses ≥0.01 M⊙. The resulting orbital period ranges are ≈2.52 − 2.66 d and ≈2.66 − 3.00 d for He CVs and AM CVn binaries, respectively. For systems with initial post-CE companions more massive than ∼1.2 M⊙, for the metallicity (i.e. solar) and treatment of core overshooting we adopted, core overshooting during main-sequence evolution leads to a quick formation of a relatively massive helium core (≳0.07 M⊙). Thus, such systems evolve to AM CVn binaries irrespective of the white dwarf mass and the orbital period of the initial post-CE binary. We can thus firmly conclude that it seems more likely to form AM CVn binaries with donor masses ≳0.01 M⊙ from the evolution of CVs hosting nuclear evolved donors than He CVs.
In the above analysis we assumed that the duration of the post-CE evolution dominates over the time it takes to form the white dwarf. This is likely correct because the nuclear time scale of the progenitor of a 0.8 M⊙ white dwarf is much shorter that the post-CE evolution we describe here. We also implicitly assumed that each initial post-CE orbital period below three days is equally likely which represents nothing but a first guess. More solid relative numbers require to perform binary population synthesis which is beyond the scope of the current paper but will be presented in a future work.
4.2. The transition region occupied by Gaia14aae, ZTF J1637+49 and CRTS J1122–1110
Having provided a solution to the first problem by showing that the lack of hydrogen in AM CVn binaries can be reproduced by the CV channel, we now turn to the discussion on the existence of a region in the parameter space in which both He CVs and AM CVn binaries co-exist. To the best of our knowledge, this overlapping region was first identified by Green et al. (2020) and is occupied by the two AM CVn binaries Gaia14aae and ZTF J1637+49, and the He CV CRTS J1122–1110. All three systems have orbital periods longer than ∼50 min, donors with masses lower than ∼0.025 M⊙ and radii larger than ∼0.06 R⊙.
The co-existence of He CVs and AM CVn binaries in this region of the parameter space is nicely explained by the CV channel. As a matter of fact, a region where both types of system co-exist is predicted by this channel and should be actually regarded as a transition region, in which He CVs convert into AM CVn binaries. In what follows we explain in more detail how CVs end up in this region of the parameter space.
In case a CV hosts a donor with non-negligible but low helium core mass (≲0.04 M⊙) at the onset of mass transfer, it will become a He CV during post-orbital-period-minimum evolution and stay as a He CV down to donor masses of ∼0.01 M⊙. These He CVs will likely become AM CVn binaries but only at masses smaller than ∼0.01 M⊙, which are not considered here. The remaining CVs hosting nuclear evolved donors, that is, those with donors having helium core masses ≳0.04 M⊙ at the onset of mass transfer, first evolve into He CVs and stay as such for some time (up to ∼50 Myr) before becoming AM CVn binaries. For these CVs, depending on the threshold separating He CVs from AM CVn binaries and on the initial post-CE masses, the post-orbital-period-minimum system can be recognized as either a He CV or an AM CVn binary.
For a fixed adopted threshold, that is, a unique surface hydrogen abundance separating He CVs from AM CVn binaries that is adopted for all systems, and a fixed combination of initial post-CE white dwarf and companion masses, there is a unique line in the plane donor mass versus donor radius separating He CVs from AM CVn binaries. Each point on this line corresponds to a donor surface hydrogen abundance equal to the adopted threshold for a given initial post-CE orbital period. The longer the initial post-CE orbital period, the larger the donor mass and the smaller the donor radius at which the donor surface hydrogen abundance is equal to the adopted threshold. This is because the longer the initial post-CE orbital period, the more nuclear evolved the donor is at the onset of mass transfer.
Systems above this line in the plane donor mass versus donor radius are predicted to be observed as transitional CVs or He CVs, while those below it should be observed as AM CVn binaries. The exact location of the line is only weakly correlated with the initial post-CE masses. In general, the line moves towards higher donor masses, for higher initial post-CE donor masses, and towards lower donor masses, for higher initial post-CE white dwarf masses. Combining all the lines resulting from different combinations of initial post-CE masses, a region in the plane donor mass versus donor radius arises corresponding to all possible evolutionary stages for which the donor surface hydrogen abundance is equal to the adopted threshold. This region can be regarded as the transition region, in which He CVs are converting to AM CVn binaries. An important consequence of the existence of this transition region is that whether a system located inside this region is recognized as a He CV or an AM CVn binary depends on the initial post-CE white dwarf and donor masses.
We show in Fig. 5 as a grey area the transition region for the threshold we assume, that is, a surface hydrogen abundance of 10−4, together with the three systems with significantly bloated donors, namely, Gaia14aae, ZTF J1637+49 and CRTS J1122–1110. We built this region by considering five different initial post-CE white dwarf masses (0.6, 0.7, 0.8, 0.9, and 1.0 M⊙) and four different initial post-CE donor masses (1.00, 1.05, 1.10, and 1.15). The initial post-CE orbital periods were chosen such that, for each combination of initial post-CE masses, the entire parameter space for the formation of AM CVn binaries was covered. We have assumed a fixed threshold but as soon as larger samples of He CV and AM CVn binaries with bloated donors will be available, assuming a range of surface hydrogen abundances might be more realistic. The higher the threshold surface hydrogen abundance separating He CVs from AM CVn binaries, the higher the donor mass at which the transition takes place. For a range of threshold abundances, the transition region would thus be more extended than that shown in Fig. 5.
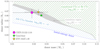 |
Fig. 5. Predicted regions of parameter space for transitional CVs and He CVs (hatched green region) and AM CVn binaries (hatched blue region) as well as the transition region in which He CVs evolve into AM CVn binaries (grey area). The transition region is characterized by the evolutionary stages for which the surface hydrogen abundance is 10−4. To illustrate this transition region we assumed different initial post-CE white dwarf masses (0.6, 0.7, 0.8, 0.9 and 1.0 M⊙) and companion masses (1.00, 1.05, 1.10, and 1.15 M⊙), and covered the entire range of orbital periods such that each combination of masses led to the formation of AM CVn binaries. Systems located below the transition region have surface hydrogen abundances smaller than 10−4, irrespective of the initial post-CE conditions. In this region our model only predicts AM CVn binaries to be found. This AM CVn binary region has a lower limit defined by the radius–mass relation of the lowest-entropy donor in our simulations, which is consistent with the radius–mass relation of a cold, fully degenerate white dwarf. Systems located above the transition region have surface hydrogen abundances greater than 10−4 regardless of the initial post-CE parameters. According to our model, in this region only He CVs and transitional CVs should be found. On the other hand, systems located in the transition region, such as Gaia14aae (green star), ZTF J1637+49 (yellow star), and CRTS J1122–1110 (magenta square), can have surface hydrogen abundances greater or smaller than 10−4, depending on the initial post-CE properties. Therefore, our model predicts that in this transition region both He CVs and AM CVn binaries should exist as it seems to be the case. For more details, see Sect. 4.2. |
Systems located above the transition region will be observed as either transitional CVs, or He CVs, or something in between, since above the transition region the donor surface hydrogen abundance is always > 10−4, irrespective of the initial post-CE conditions. Similarly, systems located below the transition region will be observed as AM CVn binaries because the donor surface hydrogen abundance is always < 10−4, regardless of the initial post-CE conditions. The region corresponding to AM CVn binaries is limited by the radius–mass relation of a cold, fully degenerate white dwarf, as a donor in an AM CVn binaries cannot have a radius smaller than that. Finally, systems located inside the transition region, such as Gaia14aae, ZTF J1637+49 and CRTS J1122–1110, can be observed as either He CVs or AM CVn binaries. Whether a particular system is observed as a He CV or an AM CVn binary, that is, whether the surface hydrogen abundance of the donor has dropped below detection levels or not depends on its initial post-CE conditions.
The transition region is restricted to donor masses between ∼0.01 − 0.15 M⊙. The lower limit corresponds to the smallest donor masses we investigated. It might well be that the transition region extends to lower donor masses but this region is not covered by our simulations. The upper limit is set by the age of the Universe. Systems with donor masses greater than ∼0.15 M⊙ take a very long time to become semi-detached again after the onset of the detached phase so that their total ages become longer than the Hubble time. Thus, CVs with donor masses ≳0.15 M⊙ when magnetic braking becomes inefficient will be observed as detached double white dwarf binaries.
The extension of the transition region in terms of donor radii depends on the donor masses as shown in Fig. 5. At donor masses ≳0.06 M⊙, the transition region is very narrow, which is a consequence of the chemical profile of the donor at the onset of mass transfer. The transition at these masses takes place when the mass of the helium core of the donor at the onset of mass transfer is ≳0.08 M⊙. Additionally, the time a given system takes to become an AM CVn binary strongly correlates with the donor mass. The larger the donor mass, the shorter the transition time-scale. The transition during post-orbital-period-minimum evolution takes less than ∼10 Myr. At these relatively large donor masses, the systems above the transition region are still evolving towards the orbital period minimum, so they corresponds to systems that are either transitional CVs or He CVs, while those below are AM CVn binaries. Provided the narrowness of the transition region at these high donor masses, we can safely conclude that whether such a system is observed as a He CV or an AM CVn binary does not depend on the initial post-CE conditions. Instead, the location of the transition for these large donor masses depends exclusively on the evolution of the donor star.
On the other hand, the transition region is sufficiently broad for donor masses ≲0.06 M⊙. If the mass of the helium core of the donor at the onset of mass transfer is ≲0.08 M⊙, the transition occurs at these donor masses and the transition time-scale can be as long as ∼50 Myr, for the lowest donor masses. At these donor masses, whether a system is observed as a He CV or an AM CVn binary strongly depends on the initial post-CE conditions. Therefore, observed He CVs belonging to the transition region, such as CRTS J1122–1110, still have enough hydrogen to be detected but are very close to convert to AM CVn binaries, while observed AM CVn binaries inside the region, such as Gaia14aae and ZTF J1637+49, have just lost enough hydrogen so that it is currently at a non-detectable level.
Given the importance of the three systems located in the transition region, we show in Fig. 6 examples of evolutionary sequences that can explain their properties. Unfortunately, due to large uncertainties in the measured parameters of ZTF J1637+49 and the fact that for CRTS J1122–1110 the mass ratio is only estimated from the superhump excess–mass ratio relation, discussing the tracks for these two systems in detail represents a rather futile exercise. However, as the parameters of Gaia14aae are sufficiently precise, we will discuss this system and the corresponding evolutionary track in more detail in what follows.
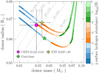 |
Fig. 6. Three evolutionary tracks around the orbital period minimum that illustrate the evolution towards He CVs and subsequently to AM CVn binaries in the plane donor mass versus donor radius. These evolutionary sequences can explain the observed properties of the AM CVn binaries Gaia14aae (green star) and ZTF J1637+49 (yellow star) and the He CV CRTS J1122–1110 (magenta square), which lie within the transition region as shown in Fig. 5. These models have initial post-CE orbital periods, white dwarf and donor star masses, and mass of the helium core of the donor at the onset of mass transfer given by the following values: 1.14 d, 0.90, 1.15, and ≈0.061 M⊙ (top track); 2.495 d, 1.00, 1.00, and ≈0.043 M⊙ (middle track); and 1.01 d, 0.87, 1.16, and ≈0.070 M⊙ (bottom track). The only difference between the AM CVn binaries Gaia14aae and ZTF J1637+49 and the He CV CRTS J1122–1110 is the surface hydrogen abundance, which is still in the detectable regime for the latter. |
4.3. The importance of magnetic braking during post-orbital-period-minimum evolution
An important aspect of systems occupying the transition region discussed in Sect. 4.2 is that they all contain oversized donors. In fact, the donor radii in these systems are much larger than expected for degenerate objects of the same mass. Our models naturally explain this. As an example, we show in Fig. 7 an evolutionary track that can explain the properties of Gaia14aae assuming an initial post-CE orbital period, white dwarf mass and companion mass of 1.01 d, and 0.87 and 1.16 M⊙, respectively, leading to a helium core mass of 0.07 M⊙, at the onset of mass transfer. At the orbital period of Gaia14aae (i.e. 49.7 min), the white dwarf mass is identical to its initial post-CE mass as the mass transfer rate never reaches values high enough to allow for mass growth during CV evolution. The donor mass and radius are 0.0246 M⊙ and 0.0608 R⊙ and the surface hydrogen abundance is 5.19 × 10⁻⁵. These values are in excellent agreement with those derived from observations (Green et al. 2018b, 2019), that is, a white dwarf mass of 0.87 ± 0.02 M⊙, donor mass of 0.0250 ± 0.0013 M⊙, donor radius of 0.0603 ± 0.0003 R⊙, and a surface hydrogen abundance of ≲10−4. It is important to keep in mind that the shown model is just an example of several tracks that are able to explain Gaia14aae. Keeping the white dwarf mass fixed to the observed value, we can typically find equally good models for different initial post-CE companion masses in the range of ∼1 − 1.16 M⊙, as long as the initial post-CE orbital period is changed accordingly.
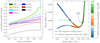 |
Fig. 7. Magnetic braking during post-orbital-period-minimum evolution is crucial for explaining systems such as Gaia14aae (green star), ZTF J1637+49 and CRTS J1122–1110. We ran two models, one allowing for magnetic braking during post-orbital-period-minimum evolution (solid lines) and one assuming no magnetic braking after the hydrogen envelope vanishes at the orbital period minimum (dashed lines). In both cases, the initial post-CE orbital period, white dwarf and companion masses were 1.01 d, 0.87 and 1.16 M⊙, respectively, and the mass of the helium core of the donor at the onset of mass transfer was 0.07 M⊙. If gravitational wave radiation is the only orbital angular momentum loss mechanism, the existence of Gaia14aae, ZTF J1637+49, and CRTS J1122–1110 cannot be explained because the longer mass-loss timescale causes the entropy of the donor to drop (dashed lines in the left panel) and the donor to relax towards thermal equilibrium. If, on the other hand, orbital angular momentum loss is sufficiently strong, the central entropy of the donor remains high (solid lines in the left panel) which explains why the donors in Gaia14aae, ZTF J1637+49, and CRTS J1122–1110 are significantly oversized for their masses and orbital periods. See Sect. 4.3 for more details. |
The excellent agreement between observations and theoretical predictions depends crucially on the strong orbital angular momentum loss provided by the CARB model. According to the latter, CVs evolving to the broad portion of the transition region shown in Fig. 5 never detach, that is, magnetic braking is removing orbital angular momentum throughout the evolution which results in continuous mass transfer, even during post-orbital-period-minimum evolution. This is because a non-negligible portion of the envelope of the donor remains convective and magnetic braking dominates orbital angular momentum loss. Therefore, the mass-loss timescale remains short enough to keep the donor out of thermal equilibrium, that is, the entropy remains high and the donor substantially bloated.
To illustrate the importance of magnetic braking during post-orbital-period-minimum evolution, we ran the same model that provided the excellent fit but this time we arbitrarily suppressed magnetic braking when the hydrogen envelope vanishes at the orbital period minimum. The corresponding evolution is shown in Fig. 7 by the dashed lines. Apparently, as soon as magnetic braking turns off, the donor starts to become increasingly degenerate and its radius drops as it loses mass. At the donor mass of Gaia14aae, the radius is predicted to be significantly smaller than observed, and it drops even further as the evolution continues.
The left panel of Fig. 7 shows entropy profiles of the donors for both simulations and further illustrates the evolution in both cases. The first entropy profile corresponds to the moment when the hydrogen envelope vanishes at a donor mass of 0.0644 M⊙ for both simulations. At this moment, the donor is only slightly degenerate as its central entropy is high (green lines). During the subsequent evolution, the entropy profiles significantly change, especially near the centre, and their evolution depends critically on whether orbital angular momentum loss due to magnetic braking is incorporated or not. When the donor mass drops to 0.03 M⊙ (blue lines), both models predict completely different entropy profiles. In case magnetic braking is suppressed, the donor quickly becomes highly degenerate and reaches a very low value near the centre at a donor mass of 0.01 M⊙ (black dashed line). This decrease in the central entropy allows the donor to cool and contract and occurs because the mass-loss timescale is long enough. In contrast, if magnetic braking is constantly removing orbital angular momentum, the central entropy of the donor remains roughly constant down to a mass of 0.01 M⊙. This occurs because the orbital-angular-momentum-loss timescale is always much shorter than the thermal timescale of the donor, which keeps the entropy high and the donor bloated, consistent with the radii inferred from observations.
The strength of orbital angular momentum loss in interacting binaries is frequently estimated based on observational constraints on either the radius of the donor star or the mass transfer rate. Both, the donor radius as well as the mass transfer rate depend fundamentally on the orbital angular momentum loss rate. Orbital angular momentum loss drives mass transfer which in turn drives the donor out of thermal equilibrium. We have demonstrated that our model can reasonably well explain the radius of the donor in Gaia14aae, which is caused by efficient magnetic braking during post-orbital-period-minimum evolution (Fig. 7). The mass transfer rate our model predicts for Gaia14aae is ∼6 × 10⁻¹⁰ M⊙ yr−1. A robust test for predicted mass transfer rates is provided by the disc instability model. The critical mass transfer rate separating outbursting and persistent disc systems has been successfully used to constrain other parameters of accreting binaries, even including their distances (Schreiber & Gänsicke 2002; Schreiber & Lasota 2007; Schreiber 2013). According to Lasota et al. (2008, their Eq. (2)), the limiting accretion rate for Gaia14aae (assuming a viscosity parameter of α = 0.1) is 8.3 × 10⁻⁹ M⊙ yr−1 which largely exceeds the mass transfer rate predicted by our model which is consistent with the fact that Gaia14aae is showing outbursts in its light curve (Campbell et al. 2015).
While our prediction thus agrees with the solid upper limit that can be derived from the disc instability model, the only estimate for the mass transfer rate in this system derived from observations is an order of magnitude lower than our model predicts, that is, ∼3 × 10⁻¹¹ M⊙ yr−1 (Ramsay et al. 2018). We argue that this mass transfer rate derived from observations most likely underestimates the true mass transfer rate. First of all, the measured mass transfer rate and the measured donor star radius directly contradict each other. It appears impossible that Gaia14aae could have a mass transfer rate as low as estimated by Ramsay et al. (2018) and at the same time a donor that is as significantly bloated as measured by Green et al. (2019). Either the donor radius must be smaller to be consistent with the observationally estimated mass transfer rate, or the mass transfer rate must be higher to be consistent with the observationally estimated donor radius. Interestingly, if we arbitrarily turn off magnetic braking during post-orbital-period-minimum evolution (dashed line in the right panel of Fig. 7), the donor radius is significantly smaller than the one derived from observations but the predicted mass transfer rate (∼2 × 10⁻¹¹ M⊙ yr−1) agrees with the value estimated by Ramsay et al. (2018).
As only one of the measurements can be correct, and given that estimates of the mass transfer rates in accreting white dwarf binaries are notoriously uncertain, we strongly believe that in the case of Gaia14aae the mass transfer rate is higher than has been estimated while the measurement of the donor radius is correct. The mass transfer rate has been estimated based on modelling the eclipse light curve and subsequent estimates of the contributions from the bright spot. This approach includes a rather arbitrary assumption of the spectral response of the bright spot and further assumes that all the overflowing material dissipates a fraction of its kinetic energy in the bright spot, that is, the possibility of stream overflow (Schreiber & Hessman 1998) is not considered. We believe that combining the uncertainties related to these assumptions can most likely make up a difference of one order of magnitude. In contrast, deriving the donor star radius from eclipse light curves requires much less assumptions and therefore represents a more reliable measurement.
In any event, even if the donor star radius turns out to be smaller than estimated and the measured mass transfer rate to be correct, we could most likely still explain Gaia14aae. We would just need a model for which magnetic braking would be much weaker at the orbital period of Gaia14aae. This would simply require the initial post-CE binary to have a longer orbital period so that the donor would have a more massive helium core at the onset of mass transfer.
4.4. Solving the second problem: fine tuning
In Sect. 4.1 we addressed the problem associated with the hydrogen surface abundances predicted by the CV channel and showed that this channel is not only producing He CVs as previously thought but also He CVs that quickly convert to AM CVn binaries. Perhaps somewhat surprising, it seems even more likely to form He CVs that subsequently convert to AM CVn binaries than He CVs that remain as such since the orbital period range from which the latter are formed is narrower than that from which the former are formed. We now turn our attention to the second frequently mentioned problem of the CV formation channel for AM CVn binaries, that is, the claim that only a small range of initial post-CE parameters leads to the formation of AM CVn binaries from CVs with evolved donors, often called the fine-tuning problem. To that end we investigated in more detail the different outcomes of CV evolution taking into account a broad range of the initial post-CE binary parameter space.
The boundaries separating the different CV evolution outcomes are strongly dependent on the combination of masses (white dwarf and companion) as well as on the assumed magnetic braking recipe. In other words, for a given combination of masses and magnetic braking prescription, there are unique initial post-CE orbital periods separating the following outcomes for systems evolving through dynamically stable mass transfer: (i) the CV remains as a typical CV throughout the evolution; (ii) the CV evolves to a He CV and remains as such down to a donor mass of ∼0.01 M⊙; (iii) the CV first evolves to a He CV and afterwards to an AM CVn binary at donor masses ≳0.01 M⊙; (iv) the CV evolves to a detached double white dwarf binary.
A very short initial post-CE orbital period leads to outcome (i). As the initial post-CE orbital period increases the CV switches its pathway successively from (i) to (iv). The reason for this is simply that the longer the initial post-CE orbital period, the more nuclear evolved the donor, and in turn the more massive the helium core of the donor at the onset of mass transfer. The transition between the outcomes (iii) and (iv) exists because systems that detach at very long orbital periods may not manage to come into contact again within the Hubble time.
The above listed possible outcomes of post-CE evolution require dynamically stable mass transfer. In case the donor is initially significantly more massive than the white dwarf or in case the donor is highly evolved, mass transfer can be dynamically unstable. Dynamically unstable mass transfer can happen when the donor is initially either a main-sequence star, a sub-giant, or a red giant. Unless the orbital period at the onset of dynamically unstable mass transfer is very long (i.e. of the order of months or even years), the two stars will merge.
To estimate under which conditions a given initial post-CE binary evolves into a He CV or AM CVn binary, we calculated a small grid of evolutionary tracks. We varied the white dwarf mass from 0.4 to 1.0 M⊙, in steps of 0.1 M⊙, the companion mass from 1.0 to 1.5 M⊙, in steps of 0.1 M⊙, and the orbital period from 0.25 to 5 d. We complemented this coarse but broad grid with a finer gird for the specific case corresponding to a white dwarf mass of 0.6 M⊙. For the latter grid we used steps of 0.025 M⊙ for the companion masses and steps of 0.2 d for the orbital period. For both grids we defined as AM CVn binaries those systems that at some point during their evolution reach a surface hydrogen abundance below 10−4. The results for both experiments are shown in Fig. 8 where the shaded regions correspond to the parameter space of initial post-CE conditions that leads to the formation of an AM CVn binary. To obtain the range of orbital periods for a given white dwarf mass in the panel on the left (broad but coarse grid), we took into account all companion masses we investigated.
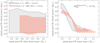 |
Fig. 8. Initial parameters of post-CE binaries that first evolve to CVs and subsequently to AM CVn binaries if the CARB prescription is adopted for magnetic braking for two different choices of opacities and how they are calculated throughout the atmosphere (shaded regions). To build the four shaded regions, we took into account the uncertainties given by the resolution of our grid of models, corresponding to half the step in white dwarf mass and in orbital period. Left: taking into account the full range of considered masses for the companion, systems that evolve into AM CVn binaries cover a large range of orbital periods and white dwarf masses. For our standard assumptions, however, models with initial post-CE white dwarf masses lower than ∼0.55 M⊙ evolve into dynamically unstable mass transfer at the onset of mass transfer and thus do not lead to AM CVn binaries (red hatched region). If the opacity from Ferguson et al. (2005) coupled with a different treatment of how they are computed is adopted instead, we get dynamically stable mass transfer even for initial post-CE white dwarf and companion masses of ∼0.4 − 0.5 and 1.3 M⊙ (grey shaded region). Thus, if magnetic braking is sufficiently strong, no fine tuning is need to produce AM CVn binaries from CVs. Right: a finer grid calculated for a fixed white dwarf mass (0.6 M⊙) illustrates a relation between orbital period and companion mass. The higher the companion mass, the shorter the orbital period. See Sect. 4.4 for more details. |
To explore to some extent the impact of stellar evolution assumptions, we investigate two types of low-temperature radiative opacities and how they are computed throughout the atmosphere. So far in this paper, we adopted the data from Freedman et al. (2008, 2014) and used a varying opacity consistent with the local temperature and pressure throughout the atmosphere, which involves numerical integration of the hydrostatic equilibrium equation. Models calculated this way produce AM CVn binaries for parameters corresponding to the hatched red regions in Fig. 8. We also computed models using the data from Ferguson et al. (2005) and a uniform opacity, iterated to be consistent with the final surface temperature and pressure at the base of the atmosphere. The grey regions in Fig. 8 indicate which initial post-CE conditions lead to the formation of AM CVn binaries under these assumptions.
The parameter space of initial post-CE binaries leading to AM CVn binaries is affected by different choices of opacity as well as how they are used to determine the outer boundary conditions. The parameter space is significantly broader if the Ferguson et al. (2005) opacity is adopted with the iterated procedure in comparison to our standard assumptions. In particular, for white dwarf masses of 0.4 and 0.5 M⊙ in our grid, mass transfer is dynamically unstable for all investigated companion masses if the opacity from Freedman et al. (2008, 2014) is used while the same systems avoid dynamically unstable mass transfer when the opacity from Ferguson et al. (2005) is used (for companion masses as high as ∼1.3 M⊙). This is a consequence of the different outer boundary conditions and donor properties (e.g. effective temperature, surface pressure, radius) if this opacity is adopted. Other parameters are also likely playing a role such as the mixing-length theory, which also affects the star properties and its evolution through the Hertzsprung-Russell diagram.
The main message of Fig. 8, however, becomes immediately clear. If the CARB model for magnetic braking is assumed, there is obviously no fine-tuning problem. Instead, a broad range of initial post-CE binary parameters leads to the formation of AM CVn binaries. This fundamental result appears to be true irrespective of model assumptions for stellar evolution. Even more convincing, the range of initial post-CE orbital periods from which CVs give birth to AM CVn binaries, which are typically between ∼0.5 and ∼4 d, are consistent with the observed periods of detached post-CE binaries consisting of white dwarfs paired with A-, F-, G- and K-type main-sequence companions (e.g. Parsons et al. 2015; Hernandez et al. 2021, 2022a,b). Therefore our results indicate that the CV channel provides an important pathway to the formation of AM CVn binaries, which is consistent with recent birth rate estimates (El-Badry et al. 2021).
The finer grid shown on the right panel of Fig. 8 that has been calculated for a fixed white dwarf mass illustrates that the higher the companion mass, the shorter the orbital period which leads to AM CVn binaries. This correlation becomes weaker (maybe even disappears) for companions initially more massive than ∼1.2 M⊙, which is related to the structure of the core. We gradually allow core overshooting for companions with masses between 1.1 and 1.2 M⊙. For companions more massive than that, core overshooting is inherent, leading to a significant increase of the core mass which implies that the helium core already starts with a significant mass (≳0.08 M⊙). At the same time, these stars have convective cores and radiative envelopes. Since we apply magnetic braking only when the envelope is convective, the orbital period does not change significantly until the envelope becomes convective, which happens at the onset of helium core formation, when these stars evolve off the main sequence and become subgiants. For this reason, the initial post-CE orbital period has to be short so that these stars fill their Roche lobe when their helium cores are not too massive, which explains why the correlation between the orbital period and companion mass is somewhat broken when the companion mass is ≳1.2 M⊙.
5. Discussion and prospects
The two most frequently mentioned problems of the CV formation channel for AM CVn binaries are that it is difficult/impossible to produce systems that do not show any traces of hydrogen and that fine tuning of the initial post-CE conditions is required to form He CVs or AM CVn binaries from CVs. We have calculated evolutionary tracks for CVs with evolved donor stars assuming magnetic braking according to the CARB prescription (Van & Ivanova 2019). This assumption solves both problems and the formation of AM CVn binaries (with undetectable amounts of hydrogen) and He CVs is a natural consequence of CV evolution.
Our model can easily explain the observed bloated donor stars as well as the more degenerate companions in AM CVn binaries and predicts He CVs and AM CVn binaries to be found in overlapping parts of the parameter space (as observed). In what follows we discuss these findings in the context of AM CVn binary formation and our understanding of white dwarf binary formation and evolution in general. A key ingredient of our model is the assumption that the close binaries continue to experience orbital angular momentum loss due to magnetic braking even after they passed the orbital period minimum. We start our discussion by taking a more detailed look at the validity of this assumption before we relate our results to alternative channels for AM CVn binary formation and future projects.
5.1. Magnetic braking in post-orbital-period-minimum systems
We have shown in Sect. 4.3 that magnetic braking as additional source of orbital angular momentum loss during post-orbital-period-minimum evolution is crucial to reproduce systems such as CRTS J1122–1110, Gaia14aae and ZTF J1637+49. A key result of our simulations is that the entropy of the donors in these systems is kept high which means that they are only slightly degenerate (left panel of Fig. 7) and we therefore think that it is reasonable to assume magnetic braking to be active for these systems.
The main conditions for the existence of efficient orbital angular momentum loss due to magnetic braking can be summarised as follows: (i) the donor must be rapidly rotating, (ii) the donor must have a non-negligible magnetic field, which requires a non-negligible convective envelope and (iii) the donor must lose mass in a wind, which also must leave the binary. We believe these three conditions are satisfied. In case of CVs evolving to AM CVn binaries, the donor spin is always synchronised with the orbital motion, even during post-orbital-period-minimum evolution, which guarantees that condition (i) is met. If the helium core mass of the donor is lower than ∼0.1 M⊙ at the onset of mass transfer, condition (ii) is met because the donor has a non-negligible convective envelope throughout the evolution and consequently a magnetic dynamo should generate the required magnetic field. Winds of low-mass stars are in general driven by the magnetic field itself, unlike the winds of hot luminous stars which are radiatively driven. The escape velocity for the bloated donors in systems such as CRTS J1122–1110, Gaia14aae and ZTF J1637+49 does not exceed that of low-mass stars. According to Eq. (1), the required mass-loss rate in the form of fast winds is moderate, of the order of 10−17 − 10−15 M⊙ yr−1. It appears therefore reasonable to assume that the magnetic fields we expect to be generated in post-orbital-period-minimum systems are equally able to drive wind mass loss.
Interestingly, understanding standard CV evolution also seems to require extra orbital angular momentum loss, not only below the orbital period gap, but also during post-orbital-period-minimum evolution. Knigge et al. (2011) showed that to reproduce the observed orbital period minimum (≈79 min, McAllister et al. 2019) an extra source of orbital angular momentum loss corresponding to ∼1.5 times that of gravitational wave radiation is required. Similarly, the estimated properties of post-orbital-period-minimum systems can only be explained if the orbital angular momentum loss rate is higher than that provided by emission of gravitational waves (Pala et al. 2017, 2020, 2022). Magnetic braking could be the physical mechanism behind the required extra orbital angular momentum loss during post-orbital-period-minimum evolution.
The only way we can think of to further constrain magnetic braking in CVs with evolved donors would be to establish a representative (ideally complete volume limited) and well characterised sample of these systems. This would allow to confront model predictions with, for instance, the observed orbital period distribution and/or mass transfer rates (although this is difficult to measure) as a function of orbital period. This sort of comparison is powerful and can lead to useful constraints as has been shown previously for detached post-CE binaries and CVs (e.g. Gänsicke et al. 2009; Schreiber et al. 2010, 2016; Knigge et al. 2011; Belloni et al. 2020; Pala et al. 2022).
5.2. Comparison with previous works
Most previous studies dedicated to the CV channel for the formation of AM CVn binaries (e.g. Podsiadlowski et al. 2003; Nelemans et al. 2010; Goliasch & Nelson 2015; Kalomeni et al. 2016; Liu et al. 2021) assumed the relatively weak magnetic braking prescription proposed by Rappaport et al. (1983). Despite assuming the same angular momentum prescription, their main conclusions concerning the importance of the CV channel were substantially different. Podsiadlowski et al. (2003) carried out a thorough binary population synthesis study and found that the CV channel provides a potentially important channel for the formation of AM CVn binaries, being competitive with the other channels. Similarly, Liu et al. (2021) investigated the formation of AM CVn binaries that are LISA sources and found that the CV channel plays an important role in forming AM CVn binary–LISA sources in the Milky Way. On the other hand, Goliasch & Nelson (2015) and Kalomeni et al. (2016) found that the formation of AM CVn binaries through this channel requires a finely tuned set of initial post-CE conditions, which makes the contribution of this channel to the intrinsic population of AM CVn binaries negligible.
While some of the above listed investigations concluded that the role played by the CV channel in the formation of AM CVn binaries cannot simply be ignored, in most of these early works the surface abundances was not considered. Thus, it is not clear from these studies which fraction of the predicted AM CVn binary-like population are indeed AM CVn binaries, that is, systems lacking detectable amounts of hydrogen, and which ones are actually He CVs. The first who investigated the chemical composition of donors in AM CVn binaries expected from each channel were Nelemans et al. (2010). They concluded that the donors predicted by the CV channel typically have hydrogen abundances that should be detectable. This implies that, assuming relatively weak magnetic braking, the most likely outcome of CV evolution with nuclear evolved donors are He CVs, not AM CVn binaries.
We found that sufficiently strong magnetic braking, such as that provided by the CARB prescription, can overcome any potential fine-tuning problem, as illustrated in Fig. 8. This happens because high orbital angular momentum loss rates allow CVs hosting more nuclear evolved donors to evolve towards shorter orbital periods. This in turn expands the initial post-CE parameter space from which AM CVn binaries form. Assuming strong magnetic braking also guarantees that the surface hydrogen abundance of donors during post-orbital-period-minimum evolution drops to undetectable levels, as illustrated in Figs. 3, 4, 6 and 7. We can therefore conclude that the main problems faced by the CV channel were model-dependent as they arose from the assumption of weak magnetic braking. Most importantly, our results clearly indicate that AM CVn binaries formed through the CV channel may be potentially numerous, and the CV channel may be the dominant formation channel of these systems, unlike previous expectations.
The CV channel under the assumption of strong magnetic braking was recently also investigated by Sarkar et al. (2023b), hereafter S23b, who adopted their own magnetic braking prescription (Sarkar & Tout 2022). In addition to assuming a different prescription for strong magnetic braking, the work of S23b is fundamentally different to ours in several other important aspects.
First, we calculated evolutionary tracks down to the masses and radii of the observed systems while the code of S23b does not allow to remove mass from degenerate regions and is therefore unable to follow the evolution when the donor mass drops below ∼0.03 M⊙. For comparison with observed systems S23b therefore extrapolated their evolutionary tracks which might not be correct. The response of the donor star to mass transfer may change because of changes in its structure or (potentially related) changes in the orbital angular momentum loss rate as illustrated in our Fig. 7 which might not be easy to extrapolate3.
Second, in contrast to our simulations, S23b could not obtain the threshold separating convergent from divergent evolution. As explained in their work, this is a shortcoming of their simulations and can be attributed to the increasing degree of degeneracy of the core of the donor when it evolves from the subgiant phase to the red-giant phase. It is therefore not clear under which conditions their evolutionary tracks are indeed convergent and produce AM CVn binaries which, in our opinion, makes it difficult (if not impossible) to reliably estimate the relative number of initial post-CE binaries that evolve into AM CVn binaries (and thus the importance of the CV channel in general) based on their simulations.
Unsurprisingly, given the very different approaches and levels of detail, also the results obtained by S23b and by us are very different. The evolutionary tracks calculated by S23b could not explain the long-period AM CVn binaries with significantly bloated donors such as Gaia14aae and ZTF J1637+49, in sharp contrast to our findings. The same holds for systems with low-entropy donors such as GP Com and ZTF J0407–00, which are naturally explained by our tracks but cannot be reproduced by S23b. As S23b do not provide enough details about their models of the donor star, it is impossible for us to understand the reason behind the different predictions. We assume that they are related either to different assumptions concerning opacities, outer boundary conditions, and mixing theory, or caused by the fact that S23b extrapolate their evolutionary tracks (including the hydrogen abundances).
Another striking difference is that the magnetic braking prescription assumed by S23b does not lead to a detached phase when the donors are more nuclear evolved at the onset of mass transfer. For this reason, it seems unlikely that the ‘terminal’ CVs identified by El-Badry et al. (2021) can be explained by their model. Recent results indicate that the detached phase might be fundamental for explaining the existence of some detached double white dwarfs (Chen et al. 2022) and millisecond pulsars with extremely-low-mass white dwarf companions (Istrate et al. 2014; Chen et al. 2021; Soethe & Kepler 2021). More generally, it is not clear if the model of S23b can explain the observed population of CVs hosting nuclear evolved donors, transitional CVs, or He CVs since these authors compared their evolutionary tracks only with CVs hosting unevolved donors (which are clearly not the progenitors of AM CVn binaries) and AM CVn binaries.
Of course, also our general conclusion differs from that of S23b. While they concluded that the CV channel is still less important than the white dwarf and helium star channels, we suggest the opposite. We believe that our result is more reliable because our simulations provide information on which tracks converge and which ones diverge and calculate the structure of low-mass donor stars. However, we admit that also our work does not provide final evidence for the dominance of the CV channel. This would require proper binary population synthesis which is beyond the scope of this paper but will be presented in an upcoming article. Finally, following that long list of differences and disagreements, we close this section by stating that the evolutionary tracks calculated by S23b were successful in explaining the existence of systems such as YZ LMi, V396 Hya, CR Boo and HP Lib, which is in perfect agreement with our results.
5.3. Alternative formation channels
We have shown that the formation of AM CVn binaries and He CVs from CVs with evolved donors is a natural consequence of binary evolution if the CARB prescription for magnetic braking is assumed. This model can explain the characteristics of all AM CVn binaries with reliable parameters, except for AM CVn itself. In addition, no fine tuning of the initial post-CE binary parameters is required to produce AM CVn binaries from CVs. Provided that it cannot explain AM CVn itself, this of course does neither imply that our model is the only model that can explain the formation of AM CVn binaries nor that it is the one most frequently chosen by nature. Additionally, if the radii and masses of AM CVn binaries derived from the superhump excess–mass ratio relation are correct, our model is unable to explain some of the systems with donors that are sufficiently massive and large, such as SDSS J1908+3940 (Bauer & Kupfer 2021, and references therein).
The existence of these systems might imply that alternative formation channels are at work. Alternative channels proposed for AM CVn binary formation are the white dwarf and the helium star channel. Population synthesis have been performed for both channels (e.g. Nelemans et al. 2001; Liu et al. 2022) and the predicted birth rates roughly agrees with those derived from observations, although this conclusion depends on unconstrained parameters in the theoretical modelling (such as the CE efficiency) and assumptions on observational selection effects and/or biases. A strong argument in favour of the CV channel is the fact that these alternative channels are unable to predict the formation of He CVs.
There is overwhelming evidence that the white dwarf channel can neither produce He CVs nor is it easy to form AM CVn binaries with bloated donor stars in significant numbers because the last episode of mass transfer, which must be CE evolution, would need to produce a binary with an orbital period such that the donor is virtually filling its Roche lobe immediately after CE evolution. Otherwise, the white dwarf entropy would quickly drop after the white dwarf formed (e.g. Wong & Bildsten 2021). Even in such cases, present-day systems hosting bloated donors such as Gaia14aae and ZTF J1637+49 could not be explained by the white dwarf channel (van Roestel et al. 2022, their Fig. 12). This is simply because in order to explain such systems, the newly born white dwarf should have a mass lower than 0.1 M⊙, which is not possible as an outcome of CE evolution unless a thus far unknown source of energy helps to expel the CE.
Sarkar et al. (2023a) intended to circumvent these problems by assuming (i) an extremely efficient CE evolution for donors on the subgiant or early giant branch, (ii) that the pre-white dwarf is filling the Roche-lobe directly after CE evolution and (iii) that strong magnetic braking is keeping the entropy of the donor high4. Assumption (iii) is a good idea which we independently developed and incorporated in the simulations of the CV channel we present in this paper. Assumption (ii) certainly requires some fine-tuning but in principle some (most likely very few) systems could evolve exactly in that way if (and only if) assumption (i) was reasonable. However, CE evolution as efficient as assumed by Sarkar et al. (2023a) appears to be extremely unlikely if recent observational and theoretical works are taken into account.
A highly efficient CE phase for subgiants or slightly evolved giants would predict the existence of close detached binaries consisting of extremely-low-mass white dwarfs with M-dwarf companions. Such systems would be easy to identify in spectroscopic surveys (such as the Sloan Digital Sky Survey) because the relatively large white dwarfs would dominate the blue part of the spectrum. The absence of extremely-low-mass white dwarfs in observed samples of post-CE binaries (Rebassa-Mansergas et al. 2011, their Fig. 1) therefore clearly argues against very efficient CE evolution. In fact, the very same absence of extremely-low-mass white dwarfs among white dwarf plus M dwarf binaries is one of the reasons why many groups independently find small values of the CE efficiency (about one third) to be more likely (e.g. Zorotovic et al. 2010; Toonen & Nelemans 2013; Camacho et al. 2014; Cojocaru et al. 2017; Scherbak & Fuller 2023).
Interestingly, extremely-low-mass white dwarfs and pre-white dwarfs are found in detached systems with more massive secondary stars and have been shown to be consistent with resulting from dynamically stable mass transfer, based on both theoretical (e.g. Chen et al. 2017; Li et al. 2019) as well as observational results (Lagos et al. 2020; Parsons et al. 2023). A combination of CE evolution (with a small efficiency) and dynamically stable mass transfer therefore produces populations in good agreement with the observations. It appears to be impossible to obtain a similar agreement assuming the extremely efficient CE scenario assumed for subgiant or early giant donors proposed by Sarkar et al. (2023a) as this scenario would predict the existence of extremely-low-mass (pre-)white dwarfs independent of the secondary mass. In agreement with Wong & Bildsten (2021) and van Roestel et al. (2022) we can therefore exclude the white dwarf channel to produce long-period AM CVn binaries or He CVs with bloated donors.
An additional problem of the white dwarf channel has been identified by Shen (2015) who discovered that the initial phase of hydrogen-rich mass transfer leads to a nova-like eruptions on the accreting white dwarf. Dynamical friction within the expanding nova shell may then lead to consequential angular momentum loss which likely causes the binary to merge. This result does not change even if only ten per cent of the energy required to unbind the nova shell come from orbital energy. This makes the double white dwarf channel further unlikely to play a major role in AM CVn binary formation.
It is important to note, however, that if indeed a non-negligible fraction of orbital energy is required to expel the nova shell after the onset of mass transfer in the double white dwarf channel, the very same effect would lead to unstable mass transfer when the detached white dwarf binaries predicted by our model (the detached post-CVs and pre-AM CVn binaries) start mass transfer again. While this would reduce the number of AM CVn binaries predicted by our channel, it would not affect the ability of our model to explain observed AM CVn binaries as systems that just avoid the detached phase cover virtually the same parameter space (see Fig. 4).
For the second alternative channel, the helium star channel, we cannot exclude in principle that it is possible to form long-period AM CVn binaries with significantly bloated donor stars. The only work dedicated to AM CVn binaries that addressed this channel and followed the evolution to donor masses as low as 0.01 M⊙ is that by Wong & Bildsten (2021). These authors investigated only one system and showed that the donor entropy also drops and the donor cools down and contracts when the mass is sufficiently low, at orbital periods ≳40 min (their Fig. 1). We conclude that, for the time being, the CV channel is the only formation channel that predicts the existence of long-period AM CVn binaries and He CVs with bloated donors with similar donor masses, and therefore most likely plays a major role in the formation of AM CVn binaries and He CVs.
5.4. Future work
Our simulations show that the CV formation channel can not only explain the existence of He CVs but also that of AM CVn binaries and AM CVn binaries with bloated donor stars. In addition, the range of initial post-CE binary parameters that lead to the formation of these systems is rather broad, which means that no fine-tuning of the initial post-CE conditions is required. However, we are well aware of the fact that our simulations depend to some degree on assumptions concerning still uncertain parameters and processes during stellar evolution. Testing dependencies of model predictions on assumptions concerning the outer boundary condition, opacity, mixing, chemical diffusion, or rotation represents a natural next step towards a better understanding of the CV formation channel. While representing a necessary exercise, most likely, the parameter space of initial conditions for post-CE binaries that evolve into He CVs and AM CVn binaries may slightly depend on the above-mentioned assumptions, but we expect the model to robustly predict AM CVn binaries and He CVs independently of these details of stellar structure and evolution.
A probably much more constraining test for the CV formation channel, would consist in performing dedicated binary population synthesis and comparing model predictions concerning the entire population of AM CVn binaries and He CVs with a representative sample of observed systems. Performing theoretical binary population models using our model for CV evolution is clearly possible and we intend to do so in the near future. The most convenient approach will be to use rapid binary evolution codes such as BSE (Hurley et al. 2000, 2002) to simulate the evolution of main sequence binary stars and CE evolution. Using such a fast code to describe the formation of post-CE binaries will allow us to study the impact of model assumptions that are critical such as the CE efficiency, stability of mass transfer, and the zero-age binary population. For the subsequent evolution, we will have to use the MESA code adopting the scheme we presented in this work to produce correct model predictions.
Interestingly, performing these binary population models will allow us to compare our predictions with observed samples of four different white dwarf binary stars: detached post-CE binaries with intermediate mass companions, CVs with evolved donors, AM CVn binaries and He CVs, and detached double white dwarfs containing extremely-low-mass white dwarfs (because of the extended detached phase we predict for binaries with sufficiently evolved donors at the onset of mass transfer). The latter are important sources of low-frequency gravitational waves (Chen et al. 2022). While so far for none of these white dwarf binaries a complete volume limited sample has been established, thanks to Gaia and photometric variability surveys (e.g. van Roestel et al. 2022; El-Badry et al. 2021), such samples might be within reach in the near future.
6. Conclusions
We have carried out dedicated binary evolution models of the CV channel for the formation of AM CVn binaries using the MESA code. The main criticisms this evolutionary channel was facing in the past were that it is unable to produce AM CVn binaries with undetectable amounts of hydrogen (a defining feature of AM CVn binaries) and that only a small part of the initial post-CE binary parameter space leads to the formation of AM CVn binaries or He CVs. In other words, to make the channel work fine tuning of the initial post-CE conditions is required for CVs to evolve into AM CVn binaries. Both these arguments against the CV formation channel are model-dependent. Adopting the CARB model for magnetic braking, which provides sufficiently strong orbital angular momentum loss, CV evolution with more nuclear evolved donors is convergent, leading to more hydrogen-deficient AM CVn binary donors. As more nuclear evolved donors are bigger and thus necessarily require longer orbital periods prior to the onset of mass transfer, also the range of initial post-CE conditions that lead to the formation of AM CVn binaries significantly increases which solves the fine-tuning problem. Our model can explain the characteristics of virtually all observed AM CVn binaries with reliable parameters including those with bloated donors. The only exception so far is AM CVn itself which has likely formed through one of the alternative channels. While our results indicate that CVs most likely play an important role in the formation of AM CVn binaries, further calculations are still needed to address how stellar evolution assumptions affect the evolutionary tracks. We also plan to perform proper binary population synthesis for AM CVn binary formation from CVs assuming the CARB model for magnetic braking to estimate the relative importance of the CV formation channel for the observed AM CVn binary population.
Taking a closer look, it seems that the extrapolation of the red track in Fig. 10 of (S23b, their model 1), does not follow the slope of the track. Instead there seems to be a kink when the extrapolation connects to the calculated track at ∼0.03 M⊙.
The term ‘helium star channel’ traditionally refers to systems containing (at least for some time) a naked helium burning star donor (e.g. Nelemans et al. 2010; Solheim 2010). In the channel proposed by Sarkar et al. (2023a), the donor mass is too small for helium burning to ignite. Therefore, their donors should be called semi-degenerate pre-helium white dwarfs (e.g. Maxted et al. 2014) and the corresponding evolution should be considered as part of the white dwarf channel.
Acknowledgments
We thank the Kavli Institute for Theoretical Physics (KITP) for hosting the program “White Dwarfs as Probes of the Evolution of Planets, Stars, the Milky Way and the Expanding Universe”. This research was supported in part by the National Science Foundation under Grant No. NSF PHY-1748958. We thank Matthew J. Green and S. Wong for pleasant and helpful discussions during the KITP program. D.B. acknowledges financial support from FONDECYT grant number 3220167. M.R.S. was supported from FONDECYT grant number 1221059 and ANID, – Millennium Science Initiative Program – NCN19_171.
References
- Amaro-Seoane, P., Audley, H., Babak, S., et al. 2017, ArXiv e-prints [arXiv:1702.00786] [Google Scholar]
- Amaro-Seoane, P., Andrews, J., Arca Sedda, M., et al. 2023, Liv. Rev. Relativ., 26, 2 [NASA ADS] [CrossRef] [Google Scholar]
- Angulo, C., Arnould, M., Rayet, M., et al. 1999, Nucl. Phys. A, 656, 3 [Google Scholar]
- Ashley, R. P., Marsh, T. R., Breedt, E., et al. 2020, MNRAS, 499, 149 [NASA ADS] [CrossRef] [Google Scholar]
- Augusteijn, T., van der Hooft, F., de Jong, J. A., & van Paradijs, J. 1996, A&A, 311, 889 [NASA ADS] [Google Scholar]
- Bauer, E. B., & Kupfer, T. 2021, ApJ, 922, 245 [NASA ADS] [CrossRef] [Google Scholar]
- Belczynski, K., Kalogera, V., Rasio, F. A., et al. 2008, ApJS, 174, 223 [Google Scholar]
- Belloni, D., & Schreiber, M. R. 2023, in Handbook of X-ray and Gamma-ray Astrophysics, eds. C. Bambi, & A. Santangelo (Singapore: Springer Nature), 1 [Google Scholar]
- Belloni, D., Schreiber, M. R., Zorotovic, M., et al. 2018, MNRAS, 478, 5639 [Google Scholar]
- Belloni, D., Schreiber, M. R., Pala, A. F., et al. 2020, MNRAS, 491, 5717 [Google Scholar]
- Beuermann, K., Breitenstein, P., & Schwab, E. 2022, A&A, 657, A101 [NASA ADS] [CrossRef] [EDP Sciences] [Google Scholar]
- Bildsten, L., Shen, K. J., Weinberg, N. N., & Nelemans, G. 2007, ApJ, 662, L95 [Google Scholar]
- Breedt, E., Gänsicke, B. T., Marsh, T. R., et al. 2012, MNRAS, 425, 2548 [NASA ADS] [CrossRef] [Google Scholar]
- Buchler, J. R., & Yueh, W. R. 1976, ApJ, 210, 440 [NASA ADS] [CrossRef] [Google Scholar]
- Burdge, K. B., El-Badry, K., Marsh, T. R., et al. 2022, Nature, 610, 467 [NASA ADS] [CrossRef] [Google Scholar]
- Camacho, J., Torres, S., García-Berro, E., et al. 2014, A&A, 566, A86 [NASA ADS] [CrossRef] [EDP Sciences] [Google Scholar]
- Campbell, H. C., Marsh, T. R., Fraser, M., et al. 2015, MNRAS, 452, 1060 [NASA ADS] [CrossRef] [Google Scholar]
- Cassisi, S., Potekhin, A. Y., Pietrinferni, A., Catelan, M., & Salaris, M. 2007, ApJ, 661, 1094 [NASA ADS] [CrossRef] [Google Scholar]
- Chen, X., Maxted, P. F. L., Li, J., & Han, Z. 2017, MNRAS, 467, 1874 [NASA ADS] [CrossRef] [Google Scholar]
- Chen, H.-L., Tauris, T. M., Han, Z., & Chen, X. 2021, MNRAS, 503, 3540 [NASA ADS] [CrossRef] [Google Scholar]
- Chen, H.-L., Tauris, T. M., Chen, X., & Han, Z. 2022, ApJ, 925, 89 [NASA ADS] [CrossRef] [Google Scholar]
- Chugunov, A. I., Dewitt, H. E., & Yakovlev, D. G. 2007, Phys. Rev. D, 76, 025028 [NASA ADS] [CrossRef] [Google Scholar]
- Cojocaru, R., Rebassa-Mansergas, A., Torres, S., & García-Berro, E. 2017, MNRAS, 470, 1442 [NASA ADS] [CrossRef] [Google Scholar]
- Copperwheat, C. M., Marsh, T. R., Littlefair, S. P., et al. 2011, MNRAS, 410, 1113 [NASA ADS] [CrossRef] [Google Scholar]
- Cyburt, R. H., Amthor, A. M., Ferguson, R., et al. 2010, ApJS, 189, 240 [NASA ADS] [CrossRef] [Google Scholar]
- D’Antona, F., & Tailo, M. 2022, Astrophys. Space Sci. Lib., 465, 201 [CrossRef] [Google Scholar]
- Deloye, C. J., Taam, R. E., Winisdoerffer, C., & Chabrier, G. 2007, MNRAS, 381, 525 [CrossRef] [Google Scholar]
- Deng, Z.-L., Li, X.-D., Gao, Z.-F., & Shao, Y. 2021, ApJ, 909, 174 [NASA ADS] [CrossRef] [Google Scholar]
- Echevarría, J., Michel, R., Costero, R., & Zharikov, S. 2007, A&A, 462, 1069 [NASA ADS] [CrossRef] [EDP Sciences] [Google Scholar]
- Echevarría, J., Smith, R. C., Costero, R., Zharikov, S., & Michel, R. 2008, MNRAS, 387, 1563 [CrossRef] [Google Scholar]
- El-Badry, K., Rix, H.-W., Quataert, E., Kupfer, T., & Shen, K. J. 2021, MNRAS, 508, 4106 [CrossRef] [Google Scholar]
- Ergma, E., & Sarna, M. J. 1996, MNRAS, 280, 1000 [CrossRef] [Google Scholar]
- Fedorova, A. V., & Ergma, E. V. 1989, Ap&SS, 151, 125 [NASA ADS] [CrossRef] [Google Scholar]
- Ferguson, J. W., Alexander, D. R., Allard, F., et al. 2005, ApJ, 623, 585 [Google Scholar]
- Freedman, R. S., Marley, M. S., & Lodders, K. 2008, ApJS, 174, 504 [NASA ADS] [CrossRef] [Google Scholar]
- Freedman, R. S., Lustig-Yaeger, J., Fortney, J. J., et al. 2014, ApJS, 214, 25 [CrossRef] [Google Scholar]
- Freytag, B., Ludwig, H. G., & Steffen, M. 1996, A&A, 313, 497 [NASA ADS] [Google Scholar]
- Fuller, G. M., Fowler, W. A., & Newman, M. J. 1985, ApJ, 293, 1 [NASA ADS] [CrossRef] [Google Scholar]
- Gänsicke, B. T., Dillon, M., Southworth, J., et al. 2009, MNRAS, 397, 2170 [NASA ADS] [CrossRef] [Google Scholar]
- Garraffo, C., Drake, J. J., Alvarado-Gomez, J. D., Moschou, S. P., & Cohen, O. 2018, ApJ, 868, 60 [NASA ADS] [CrossRef] [Google Scholar]
- Goliasch, J., & Nelson, L. 2015, ApJ, 809, 80 [Google Scholar]
- Gomez, S., Torres, M. A. P., Jonker, P. G., et al. 2021, MNRAS, 502, 48 [NASA ADS] [CrossRef] [Google Scholar]
- Gossage, S., Kalogera, V., & Sun, M. 2023, ApJ, 950, 27 [NASA ADS] [CrossRef] [Google Scholar]
- Green, M. J., Hermes, J. J., Marsh, T. R., et al. 2018a, MNRAS, 477, 5646 [NASA ADS] [Google Scholar]
- Green, M. J., Marsh, T. R., Steeghs, D. T. H., et al. 2018b, MNRAS, 476, 1663 [NASA ADS] [CrossRef] [Google Scholar]
- Green, M. J., Marsh, T. R., Steeghs, D., et al. 2019, MNRAS, 485, 1947 [NASA ADS] [CrossRef] [Google Scholar]
- Green, M. J., Marsh, T. R., Carter, P. J., et al. 2020, MNRAS, 496, 1243 [NASA ADS] [CrossRef] [Google Scholar]
- Hachisu, I., Kato, M., & Nomoto, K. 1996, ApJ, 470, L97 [CrossRef] [Google Scholar]
- Heinke, C. O., Ivanova, N., Engel, M. C., et al. 2013, ApJ, 768, 184 [NASA ADS] [CrossRef] [Google Scholar]
- Henyey, L., Vardya, M. S., & Bodenheimer, P. 1965, ApJ, 142, 841 [Google Scholar]
- Hernandez, M. S., Schreiber, M. R., Parsons, S. G., et al. 2021, MNRAS, 501, 1677 [Google Scholar]
- Hernandez, M. S., Schreiber, M. R., Parsons, S. G., et al. 2022a, MNRAS, 512, 1843 [NASA ADS] [CrossRef] [Google Scholar]
- Hernandez, M. S., Schreiber, M. R., Parsons, S. G., et al. 2022b, MNRAS, 517, 2867 [NASA ADS] [CrossRef] [Google Scholar]
- Herwig, F. 2000, A&A, 360, 952 [NASA ADS] [Google Scholar]
- Hurley, J. R., Pols, O. R., & Tout, C. A. 2000, MNRAS, 315, 543 [Google Scholar]
- Hurley, J. R., Tout, C. A., & Pols, O. R. 2002, MNRAS, 329, 897 [Google Scholar]
- Iglesias, C. A., & Rogers, F. J. 1993, ApJ, 412, 752 [Google Scholar]
- Iglesias, C. A., & Rogers, F. J. 1996, ApJ, 464, 943 [NASA ADS] [CrossRef] [Google Scholar]
- Imada, A., Isogai, K., Yanagisawa, K., & Kawai, N. 2018, PASJ, 70, 79 [Google Scholar]
- Irwin, A. W. 2004, Astrophysics Source Code Library [record ascl:1211.002] [Google Scholar]
- Istrate, A. G., Tauris, T. M., & Langer, N. 2014, A&A, 571, A45 [NASA ADS] [CrossRef] [EDP Sciences] [Google Scholar]
- Itoh, N., Hayashi, H., Nishikawa, A., & Kohyama, Y. 1996, ApJS, 102, 411 [NASA ADS] [CrossRef] [Google Scholar]
- Jermyn, A. S., Schwab, J., Bauer, E., Timmes, F. X., & Potekhin, A. Y. 2021, ApJ, 913, 72 [NASA ADS] [CrossRef] [Google Scholar]
- Jermyn, A. S., Bauer, E. B., Schwab, J., et al. 2023, ApJS, 265, 15 [NASA ADS] [CrossRef] [Google Scholar]
- Kalomeni, B., Nelson, L., Rappaport, S., et al. 2016, ApJ, 833, 83 [NASA ADS] [CrossRef] [Google Scholar]
- Knigge, C., Baraffe, I., & Patterson, J. 2011, ApJS, 194, 28 [Google Scholar]
- Kupfer, T., Steeghs, D., Groot, P. J., et al. 2016, MNRAS, 457, 1828 [NASA ADS] [CrossRef] [Google Scholar]
- Kupfer, T., Korol, V., Shah, S., et al. 2018, MNRAS, 480, 302 [NASA ADS] [CrossRef] [Google Scholar]
- Lagos, F., Schreiber, M. R., Parsons, S. G., Gänsicke, B. T., & Godoy, N. 2020, MNRAS, 499, L121 [NASA ADS] [CrossRef] [Google Scholar]
- Langanke, K., & Martínez-Pinedo, G. 2000, Nucl. Phys. A, 673, 481 [NASA ADS] [CrossRef] [Google Scholar]
- Lasota, J. P., Dubus, G., & Kruk, K. 2008, A&A, 486, 523 [NASA ADS] [CrossRef] [EDP Sciences] [Google Scholar]
- Lee, Y., Kim, S. C., Moon, D.-S., et al. 2022, ApJ, 925, L22 [NASA ADS] [CrossRef] [Google Scholar]
- Li, Z., Chen, X., Chen, H.-L., & Han, Z. 2019, ApJ, 871, 148 [NASA ADS] [CrossRef] [Google Scholar]
- Lin, J., Rappaport, S., Podsiadlowski, P., et al. 2011, ApJ, 732, 70 [NASA ADS] [CrossRef] [Google Scholar]
- Littlefield, C., Garnavich, P., Applegate, A., et al. 2013, AJ, 145, 145 [NASA ADS] [CrossRef] [Google Scholar]
- Liu, W.-M., Jiang, L., & Chen, W.-C. 2021, ApJ, 910, 22 [NASA ADS] [CrossRef] [Google Scholar]
- Liu, W. M., Yungelson, L., & Kuranov, A. 2022, A&A, 668, A80 [NASA ADS] [CrossRef] [EDP Sciences] [Google Scholar]
- Maccarone, T. J., Kupfer, T., Najera Casarrubias, E., et al. 2023, Nature, submitted [arXiv:2302.12318] [Google Scholar]
- Marsh, T. R. 1999, MNRAS, 304, 443 [NASA ADS] [CrossRef] [Google Scholar]
- Maxted, P. F. L., Bloemen, S., Heber, U., et al. 2014, MNRAS, 437, 1681 [NASA ADS] [CrossRef] [Google Scholar]
- McAllister, M., Littlefair, S. P., Parsons, S. G., et al. 2019, MNRAS, 486, 5535 [NASA ADS] [CrossRef] [Google Scholar]
- McDonald, I., & Zijlstra, A. A. 2015, MNRAS, 448, 502 [Google Scholar]
- Nagel, T., Rauch, T., & Werner, K. 2009, A&A, 499, 773 [NASA ADS] [CrossRef] [EDP Sciences] [Google Scholar]
- Nasser, M. R., Solheim, J. E., & Semionoff, D. A. 2001, A&A, 373, 222 [NASA ADS] [CrossRef] [EDP Sciences] [Google Scholar]
- Nebot Gómez-Morán, A., Gänsicke, B. T., Schreiber, M. R., et al. 2011, A&A, 536, A43 [NASA ADS] [CrossRef] [EDP Sciences] [Google Scholar]
- Nelemans, G., Portegies Zwart, S. F., Verbunt, F., & Yungelson, L. R. 2001, A&A, 368, 939 [NASA ADS] [CrossRef] [EDP Sciences] [Google Scholar]
- Nelemans, G., Yungelson, L. R., van der Sluys, M. V., & Tout, C. A. 2010, MNRAS, 401, 1347 [NASA ADS] [CrossRef] [Google Scholar]
- Nelson, L. A., Dubeau, E., & MacCannell, K. A. 2004, ApJ, 616, 1124 [NASA ADS] [CrossRef] [Google Scholar]
- Nomoto, K., Saio, H., Kato, M., & Hachisu, I. 2007, ApJ, 663, 1269 [Google Scholar]
- Oda, T., Hino, M., Muto, K., Takahara, M., & Sato, K. 1994, At. Data Nucl. Data Tables, 56, 231 [NASA ADS] [CrossRef] [Google Scholar]
- Pala, A. F., Gänsicke, B. T., Townsley, D., et al. 2017, MNRAS, 466, 2855 [NASA ADS] [CrossRef] [Google Scholar]
- Pala, A. F., Gänsicke, B. T., Breedt, E., et al. 2020, MNRAS, 494, 3799 [Google Scholar]
- Pala, A. F., Gänsicke, B. T., Belloni, D., et al. 2022, MNRAS, 510, 6110 [NASA ADS] [CrossRef] [Google Scholar]
- Parsons, S. G., Schreiber, M. R., Gänsicke, B. T., et al. 2015, MNRAS, 452, 1754 [NASA ADS] [CrossRef] [Google Scholar]
- Parsons, S. G., Hernandez, M. S., Toloza, O., et al. 2023, MNRAS, 518, 4579 [Google Scholar]
- Paxton, B., Bildsten, L., Dotter, A., et al. 2011, ApJS, 192, 3 [Google Scholar]
- Paxton, B., Cantiello, M., Arras, P., et al. 2013, ApJS, 208, 4 [Google Scholar]
- Paxton, B., Marchant, P., Schwab, J., et al. 2015, ApJS, 220, 15 [Google Scholar]
- Paxton, B., Schwab, J., Bauer, E. B., et al. 2018, ApJS, 234, 34 [NASA ADS] [CrossRef] [Google Scholar]
- Paxton, B., Smolec, R., Schwab, J., et al. 2019, ApJS, 243, 10 [Google Scholar]
- Podsiadlowski, P., Rappaport, S., & Pfahl, E. D. 2002, ApJ, 565, 1107 [NASA ADS] [CrossRef] [Google Scholar]
- Podsiadlowski, P., Han, Z., & Rappaport, S. 2003, MNRAS, 340, 1214 [NASA ADS] [CrossRef] [Google Scholar]
- Potekhin, A. Y., & Chabrier, G. 2010, Contrib. Plasma Phys., 50, 82 [NASA ADS] [CrossRef] [Google Scholar]
- Ramsay, G., Green, M. J., Marsh, T. R., et al. 2018, A&A, 620, A141 [NASA ADS] [CrossRef] [EDP Sciences] [Google Scholar]
- Rappaport, S., Verbunt, F., & Joss, P. C. 1983, ApJ, 275, 713 [Google Scholar]
- Rebassa-Mansergas, A., Nebot Gómez-Morán, A., Schreiber, M. R., Girven, J., & Gänsicke, B. T. 2011, MNRAS, 413, 1121 [NASA ADS] [CrossRef] [Google Scholar]
- Reimers, D. 1975, Mem. Soc. R. Sci. Liege, 8, 369 [NASA ADS] [Google Scholar]
- Rodríguez-Gil, P., Torres, M. A. P., Gänsicke, B. T., et al. 2009, A&A, 496, 805 [NASA ADS] [CrossRef] [EDP Sciences] [Google Scholar]
- Roelofs, G. H. A., Groot, P. J., Marsh, T. R., et al. 2005, MNRAS, 361, 487 [NASA ADS] [CrossRef] [Google Scholar]
- Roelofs, G. H. A., Groot, P. J., Nelemans, G., Marsh, T. R., & Steeghs, D. 2006, MNRAS, 371, 1231 [NASA ADS] [CrossRef] [Google Scholar]
- Rogers, F. J., & Nayfonov, A. 2002, ApJ, 576, 1064 [Google Scholar]
- Sarkar, A., & Tout, C. A. 2022, MNRAS, 513, 4169 [NASA ADS] [CrossRef] [Google Scholar]
- Sarkar, A., Ge, H., & Tout, C. A. 2023a, MNRAS, 519, 2567 [Google Scholar]
- Sarkar, A., Ge, H., & Tout, C. A. 2023b, MNRAS, 520, 3187 [NASA ADS] [CrossRef] [Google Scholar]
- Saumon, D., Chabrier, G., & van Horn, H. M. 1995, ApJS, 99, 713 [NASA ADS] [CrossRef] [Google Scholar]
- Schaller, G., Schaerer, D., Meynet, G., & Maeder, A. 1992, A&AS, 96, 269 [Google Scholar]
- Scherbak, P., & Fuller, J. 2023, MNRAS, 518, 3966 [Google Scholar]
- Schreiber, M. R. 2013, Science, 340, 932 [NASA ADS] [CrossRef] [Google Scholar]
- Schreiber, M. R., & Gänsicke, B. T. 2002, A&A, 382, 124 [NASA ADS] [CrossRef] [EDP Sciences] [Google Scholar]
- Schreiber, M. R., & Hessman, F. V. 1998, MNRAS, 301, 626 [CrossRef] [Google Scholar]
- Schreiber, M. R., & Lasota, J. P. 2007, A&A, 473, 897 [NASA ADS] [CrossRef] [EDP Sciences] [Google Scholar]
- Schreiber, M. R., Gänsicke, B. T., Rebassa-Mansergas, A., et al. 2010, A&A, 513, L7 [NASA ADS] [CrossRef] [EDP Sciences] [Google Scholar]
- Schreiber, M. R., Zorotovic, M., & Wijnen, T. P. G. 2016, MNRAS, 455, L16 [NASA ADS] [CrossRef] [Google Scholar]
- Schreiber, M. R., Belloni, D., Gänsicke, B. T., Parsons, S. G., & Zorotovic, M. 2021, Nat. Astron., 5, 648 [NASA ADS] [CrossRef] [Google Scholar]
- Shen, K. J. 2015, ApJ, 805, L6 [NASA ADS] [CrossRef] [Google Scholar]
- Shen, K. J., & Bildsten, L. 2007, ApJ, 660, 1444 [NASA ADS] [CrossRef] [Google Scholar]
- Soethe, L. T. T., & Kepler, S. O. 2021, MNRAS, 506, 3266 [NASA ADS] [CrossRef] [Google Scholar]
- Sokolovsky, K. V., Strader, J., Swihart, S. J., et al. 2022, ApJ, 934, 142 [NASA ADS] [CrossRef] [Google Scholar]
- Solheim, J. E. 2010, PASP, 122, 1133 [NASA ADS] [CrossRef] [Google Scholar]
- Sparks, W. M., & Sion, E. M. 2021, ApJ, 914, 5 [NASA ADS] [CrossRef] [Google Scholar]
- Staude, A., Schwope, A. D., & Schwarz, R. 2001, A&A, 374, 588 [NASA ADS] [CrossRef] [EDP Sciences] [Google Scholar]
- Taam, R. E., & Spruit, H. C. 1989, ApJ, 345, 972 [NASA ADS] [CrossRef] [Google Scholar]
- Thorstensen, J. R., Fenton, W. H., Patterson, J. O., et al. 2002, ApJ, 567, L49 [NASA ADS] [CrossRef] [Google Scholar]
- Timmes, F. X., & Swesty, F. D. 2000, ApJS, 126, 501 [NASA ADS] [CrossRef] [Google Scholar]
- Toonen, S., & Nelemans, G. 2013, A&A, 557, A87 [NASA ADS] [CrossRef] [EDP Sciences] [Google Scholar]
- Tutukov, A. V., Fedorova, A. V., Ergma, E. V., & Yungelson, L. R. 1985, Sov. Astron. Lett., 11, 52 [NASA ADS] [Google Scholar]
- Van, K. X., & Ivanova, N. 2019, ApJ, 886, L31 [NASA ADS] [CrossRef] [Google Scholar]
- Van, K. X., Ivanova, N., & Heinke, C. O. 2019, MNRAS, 483, 5595 [NASA ADS] [CrossRef] [Google Scholar]
- van Roestel, J., Kupfer, T., Green, M. J., et al. 2022, MNRAS, 512, 5440 [NASA ADS] [CrossRef] [Google Scholar]
- Wang, B. 2018, Res. Astron. Astrophys., 18, 049 [Google Scholar]
- Wang, B., Chen, W.-C., Liu, D.-D., et al. 2021, MNRAS, 506, 4654 [NASA ADS] [CrossRef] [Google Scholar]
- Warner, B. 1995, Cambridge Astrophysics Series, Cataclysmic Variable Stars (Cambridge: Cambridge Univ. Press) [CrossRef] [Google Scholar]
- Wolf, W. M., Bildsten, L., Brooks, J., & Paxton, B. 2013, ApJ, 777, 136 [Google Scholar]
- Wong, T. L. S., & Bildsten, L. 2021, ApJ, 923, 125 [NASA ADS] [CrossRef] [Google Scholar]
- Woudt, P. A., Warner, B., de Budé, D., et al. 2012, MNRAS, 421, 2414 [NASA ADS] [CrossRef] [Google Scholar]
- Yamaguchi, N., El-Badry, K., Rodriguez, A. C., et al. 2023, MNRAS, 524, 740 [NASA ADS] [CrossRef] [Google Scholar]
- Yaron, O., Prialnik, D., Shara, M. M., & Kovetz, A. 2005, ApJ, 623, 398 [Google Scholar]
- Yu, Z., Thorstensen, J. R., Rappaport, S., et al. 2019, MNRAS, 489, 1023 [NASA ADS] [CrossRef] [Google Scholar]
- Yungelson, L. R. 2008, Astron. Lett., 34, 620 [Google Scholar]
- Zorotovic, M., & Schreiber, M. 2022, MNRAS, 513, 3587 [NASA ADS] [CrossRef] [Google Scholar]
- Zorotovic, M., Schreiber, M. R., Gänsicke, B. T., & Nebot Gómez-Morán, A. 2010, A&A, 520, A86 [NASA ADS] [CrossRef] [EDP Sciences] [Google Scholar]
- Zorotovic, M., Schreiber, M. R., Parsons, S. G., et al. 2016, MNRAS, 457, 3867 [Google Scholar]
All Figures
|
Fig. 1. Evolution of donor mass (top panel) and mass transfer rate (bottom panel) as a function of orbital period obtained adopting the CARB model for magnetic braking. We show the evolution of three illustrative CVs with initial post-CE white dwarf and donor star masses of 0.8 and 1.1 M⊙, respectively. The initial post-CE orbital periods and donor helium core mass at the onset of mass transfer are different in each evolutionary track and are given by the following values: model 1: 2.20 d and ≈0.043 M⊙ (dot-dashed black lines), model 2: 2.34 d and ≈0.068 M⊙ (short-dashed blue lines), and model 3: 2.60 d and ≈0.105 M⊙ (solid green lines). On top of that, we also show an example of standard CV evolutionary sequence (long-dashed red lines, from Belloni & Schreiber 2023) and an example of evolutionary sequence for the white dwarf channel (long-dashed orange lines, from Wong & Bildsten 2021). The arrows in the bottom panel were added for clarity and indicate the direction of the evolution. The tracks for which the orbital period minimum is below 20 min correspond to CV evolution leading to the formation of AM CVn binaries. Model 3 represents a mixed channel in which a CV leads to a close detached double white dwarf binary that latter becomes an AM CVn binary. The final evolution of this system is similar to the white dwarf channel for AM CVn binary formation. See text for more details. |
| In the text | |
|
Fig. 2. Hertzsprung-Russell diagram (left panel) and mass–radius evolution (right panel) of the donors of the three models shown in Fig. 1, namely model 1 (dot-dashed black lines), model 2 (short-dashed blue lines) and model 3 (solid green lines). Following the onset of mass transfer, the donor luminosity, effective temperature and radius decrease. The radius of donors with relatively massive helium cores (≳0.05 M⊙) at the onset of mass transfer eventually starts to decrease faster during the evolution. In case the effective temperature reaches sufficiently high values, the convective envelope vanishes which causes magnetic braking to become inefficient and the donor to detach from its Roche-lobe (illustrated by the magenta circles for model 3). The more evolved the donor at the onset of mass transfer, the higher the donor mass at the moment the radius starts to decrease faster and the higher the maximum effective temperature reached during the evolution. |
| In the text | |
|
Fig. 3. Evolution around the orbital period minimum of the donor surface abundances (colour coded by elements) for the three models shown in Fig. 1, namely model 1 (dot-dashed lines), model 2 (short-dashed lines) and model 3 (solid lines). The hydrogen abundance quickly vanishes for model 3, which is similar to the white dwarf channel, when the system reaches the orbital period minimum. On the other hand, for model 2, the hydrogen drops to an undetectable level during early post-orbital-period-minimum evolution (between ≈20 and ≈30 min). Finally, the surface hydrogen abundance in model 1 remains high enough to be detected throughout its evolution. Meanwhile helium abundance is enhanced as the three models approach the orbital period minimum, and together with the other elements, quickly evolves towards equilibrium afterwards. That said, model 1 is a typical example of how CVs evolve to He CVs. More importantly, models 2 and 3 clearly illustrate that hydrogen is not necessarily visible in CV descendants, irrespective of the present-day orbital period. In addition, the surface abundances predicted for the two pathways leading to AM CVn binaries, that is, with (model 3) and without (model 2) a detached phase, are rather similar after hydrogen vanishes suggesting that it is very hard to distinguish between the white dwarf channel and the CV channel with respect to abundance ratios. |
| In the text | |
|
Fig. 4. Convergent CV evolution when the CARB model for magnetic braking is adopted for different initial post-CE binaries. The colour represents the log-scaled surface hydrogen abundance of the donor. Systems can be considered as AM CVn binaries if they reach shades of blue. Related objects, that is, CVs, transitional CVs, and He CVs are indicated by shades of other colours. While the assumed initial post-CE orbital periods cover values from 1.98 to 3.00 d, we fixed the initial post-CE white dwarf mass to 0.8 M⊙ and the initial post-CE companion mass to 1.1 M⊙. The evolution of the surface hydrogen abundance is strongly dependent on the mass of the helium core at the onset of mass transfer: the more massive the helium core, the lower the surface hydrogen abundance at a given orbital period during post-orbital-period-minimum evolution. CVs with donors having initially less massive helium cores bounce at longer orbital periods, leading to more massive and larger donors during AM CVn binary evolution. Along with the evolutionary tracks we included the following observed systems: CVs harbouring nuclear evolved donors (red diamonds), transitional CVs (cyan circles), He CVs (magenta squares), and AM CVn binaries (yellow stars), as described in Sect. 2.4. Except for AM CVn itself, the one with largest donor mass among AM CVn binaries, the characteristics of all AM CVn binaries can be explained by the CV channel, which means that the lack of hydrogen lines in the optical spectra of AM CVn binaries cannot be easily used as an argument against the CV formation channel. See Sect. 4.1 for more details. |
| In the text | |
|
Fig. 5. Predicted regions of parameter space for transitional CVs and He CVs (hatched green region) and AM CVn binaries (hatched blue region) as well as the transition region in which He CVs evolve into AM CVn binaries (grey area). The transition region is characterized by the evolutionary stages for which the surface hydrogen abundance is 10−4. To illustrate this transition region we assumed different initial post-CE white dwarf masses (0.6, 0.7, 0.8, 0.9 and 1.0 M⊙) and companion masses (1.00, 1.05, 1.10, and 1.15 M⊙), and covered the entire range of orbital periods such that each combination of masses led to the formation of AM CVn binaries. Systems located below the transition region have surface hydrogen abundances smaller than 10−4, irrespective of the initial post-CE conditions. In this region our model only predicts AM CVn binaries to be found. This AM CVn binary region has a lower limit defined by the radius–mass relation of the lowest-entropy donor in our simulations, which is consistent with the radius–mass relation of a cold, fully degenerate white dwarf. Systems located above the transition region have surface hydrogen abundances greater than 10−4 regardless of the initial post-CE parameters. According to our model, in this region only He CVs and transitional CVs should be found. On the other hand, systems located in the transition region, such as Gaia14aae (green star), ZTF J1637+49 (yellow star), and CRTS J1122–1110 (magenta square), can have surface hydrogen abundances greater or smaller than 10−4, depending on the initial post-CE properties. Therefore, our model predicts that in this transition region both He CVs and AM CVn binaries should exist as it seems to be the case. For more details, see Sect. 4.2. |
| In the text | |
|
Fig. 6. Three evolutionary tracks around the orbital period minimum that illustrate the evolution towards He CVs and subsequently to AM CVn binaries in the plane donor mass versus donor radius. These evolutionary sequences can explain the observed properties of the AM CVn binaries Gaia14aae (green star) and ZTF J1637+49 (yellow star) and the He CV CRTS J1122–1110 (magenta square), which lie within the transition region as shown in Fig. 5. These models have initial post-CE orbital periods, white dwarf and donor star masses, and mass of the helium core of the donor at the onset of mass transfer given by the following values: 1.14 d, 0.90, 1.15, and ≈0.061 M⊙ (top track); 2.495 d, 1.00, 1.00, and ≈0.043 M⊙ (middle track); and 1.01 d, 0.87, 1.16, and ≈0.070 M⊙ (bottom track). The only difference between the AM CVn binaries Gaia14aae and ZTF J1637+49 and the He CV CRTS J1122–1110 is the surface hydrogen abundance, which is still in the detectable regime for the latter. |
| In the text | |
|
Fig. 7. Magnetic braking during post-orbital-period-minimum evolution is crucial for explaining systems such as Gaia14aae (green star), ZTF J1637+49 and CRTS J1122–1110. We ran two models, one allowing for magnetic braking during post-orbital-period-minimum evolution (solid lines) and one assuming no magnetic braking after the hydrogen envelope vanishes at the orbital period minimum (dashed lines). In both cases, the initial post-CE orbital period, white dwarf and companion masses were 1.01 d, 0.87 and 1.16 M⊙, respectively, and the mass of the helium core of the donor at the onset of mass transfer was 0.07 M⊙. If gravitational wave radiation is the only orbital angular momentum loss mechanism, the existence of Gaia14aae, ZTF J1637+49, and CRTS J1122–1110 cannot be explained because the longer mass-loss timescale causes the entropy of the donor to drop (dashed lines in the left panel) and the donor to relax towards thermal equilibrium. If, on the other hand, orbital angular momentum loss is sufficiently strong, the central entropy of the donor remains high (solid lines in the left panel) which explains why the donors in Gaia14aae, ZTF J1637+49, and CRTS J1122–1110 are significantly oversized for their masses and orbital periods. See Sect. 4.3 for more details. |
| In the text | |
|
Fig. 8. Initial parameters of post-CE binaries that first evolve to CVs and subsequently to AM CVn binaries if the CARB prescription is adopted for magnetic braking for two different choices of opacities and how they are calculated throughout the atmosphere (shaded regions). To build the four shaded regions, we took into account the uncertainties given by the resolution of our grid of models, corresponding to half the step in white dwarf mass and in orbital period. Left: taking into account the full range of considered masses for the companion, systems that evolve into AM CVn binaries cover a large range of orbital periods and white dwarf masses. For our standard assumptions, however, models with initial post-CE white dwarf masses lower than ∼0.55 M⊙ evolve into dynamically unstable mass transfer at the onset of mass transfer and thus do not lead to AM CVn binaries (red hatched region). If the opacity from Ferguson et al. (2005) coupled with a different treatment of how they are computed is adopted instead, we get dynamically stable mass transfer even for initial post-CE white dwarf and companion masses of ∼0.4 − 0.5 and 1.3 M⊙ (grey shaded region). Thus, if magnetic braking is sufficiently strong, no fine tuning is need to produce AM CVn binaries from CVs. Right: a finer grid calculated for a fixed white dwarf mass (0.6 M⊙) illustrates a relation between orbital period and companion mass. The higher the companion mass, the shorter the orbital period. See Sect. 4.4 for more details. |
| In the text | |
Current usage metrics show cumulative count of Article Views (full-text article views including HTML views, PDF and ePub downloads, according to the available data) and Abstracts Views on Vision4Press platform.
Data correspond to usage on the plateform after 2015. The current usage metrics is available 48-96 hours after online publication and is updated daily on week days.
Initial download of the metrics may take a while.