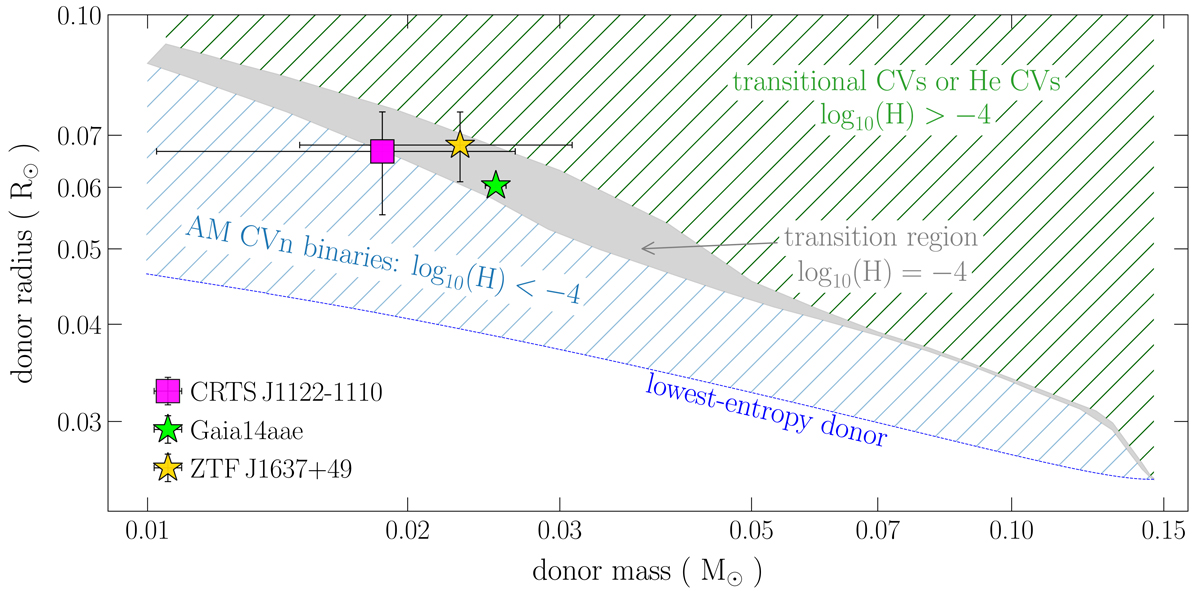
Fig. 5.
Download original image
Predicted regions of parameter space for transitional CVs and He CVs (hatched green region) and AM CVn binaries (hatched blue region) as well as the transition region in which He CVs evolve into AM CVn binaries (grey area). The transition region is characterized by the evolutionary stages for which the surface hydrogen abundance is 10−4. To illustrate this transition region we assumed different initial post-CE white dwarf masses (0.6, 0.7, 0.8, 0.9 and 1.0 M⊙) and companion masses (1.00, 1.05, 1.10, and 1.15 M⊙), and covered the entire range of orbital periods such that each combination of masses led to the formation of AM CVn binaries. Systems located below the transition region have surface hydrogen abundances smaller than 10−4, irrespective of the initial post-CE conditions. In this region our model only predicts AM CVn binaries to be found. This AM CVn binary region has a lower limit defined by the radius–mass relation of the lowest-entropy donor in our simulations, which is consistent with the radius–mass relation of a cold, fully degenerate white dwarf. Systems located above the transition region have surface hydrogen abundances greater than 10−4 regardless of the initial post-CE parameters. According to our model, in this region only He CVs and transitional CVs should be found. On the other hand, systems located in the transition region, such as Gaia14aae (green star), ZTF J1637+49 (yellow star), and CRTS J1122–1110 (magenta square), can have surface hydrogen abundances greater or smaller than 10−4, depending on the initial post-CE properties. Therefore, our model predicts that in this transition region both He CVs and AM CVn binaries should exist as it seems to be the case. For more details, see Sect. 4.2.
Current usage metrics show cumulative count of Article Views (full-text article views including HTML views, PDF and ePub downloads, according to the available data) and Abstracts Views on Vision4Press platform.
Data correspond to usage on the plateform after 2015. The current usage metrics is available 48-96 hours after online publication and is updated daily on week days.
Initial download of the metrics may take a while.