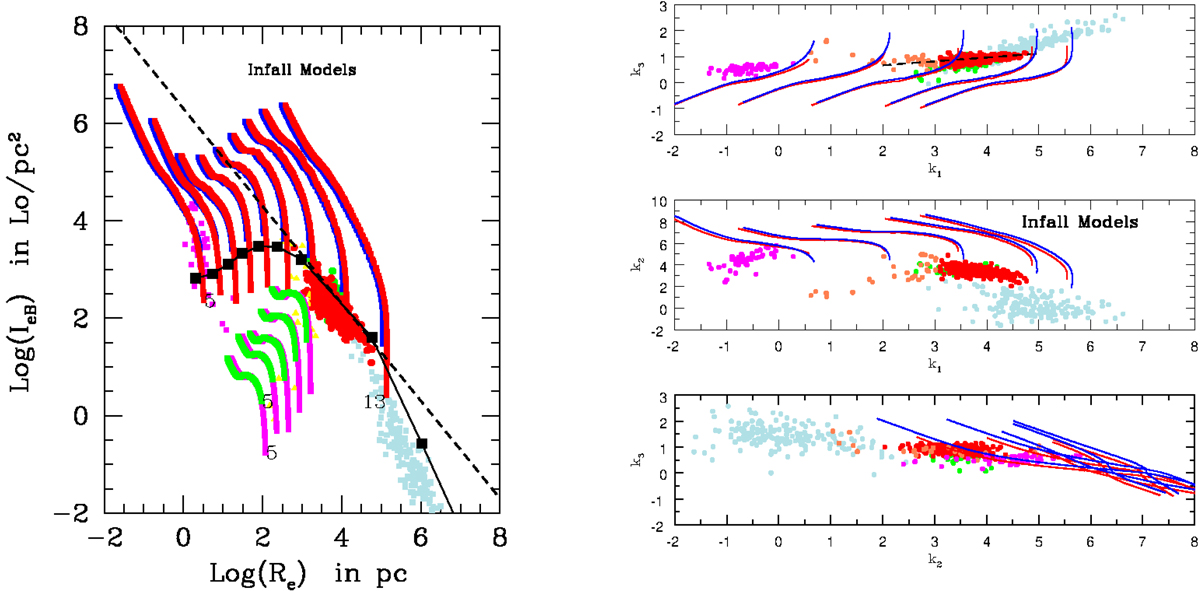
Fig. 9.
Download original image
Same as in Fig. 4. Left panel: Ie-Re plane of the model galaxies with infall. The mass MBM(TG) grows from left to right in steps of a factor of 10 from 106 to 1013 M⊙. The infall timescale, τ, and specific efficiency, ν, of star formation are listed in Table 5. The MRR relation is from Chiosi et al. (2020), the Cosmic Galaxy Shepherd. The blue lines are models with active star formation all over the evolutionary history. The red lines are models in which star formation is quenched off past the age t ≃ τ. The green and magenta lines indicate model with active (green) and quenched off (magenta) star formation, but in which the MRR relation for galaxies with stellar mass in the interval 106–109 M⊙ is that of the dwarf galaxies of Woo et al. (2008). See the text for more details. Right panel: Projections of the 3DKS. In each sub-panel, all the symbols have the same meaning as in the left panel. In each line the final stage (present age) is close to the observational data. It is worth noting that in the k3 vs. k1 plane the relation passing through all the final stages of the models with quenched star formation at the present age perfectly coincides with the FP plane of ETGs in the Virgo and Coma clusters.
Current usage metrics show cumulative count of Article Views (full-text article views including HTML views, PDF and ePub downloads, according to the available data) and Abstracts Views on Vision4Press platform.
Data correspond to usage on the plateform after 2015. The current usage metrics is available 48-96 hours after online publication and is updated daily on week days.
Initial download of the metrics may take a while.