Fig. 7.
Download original image
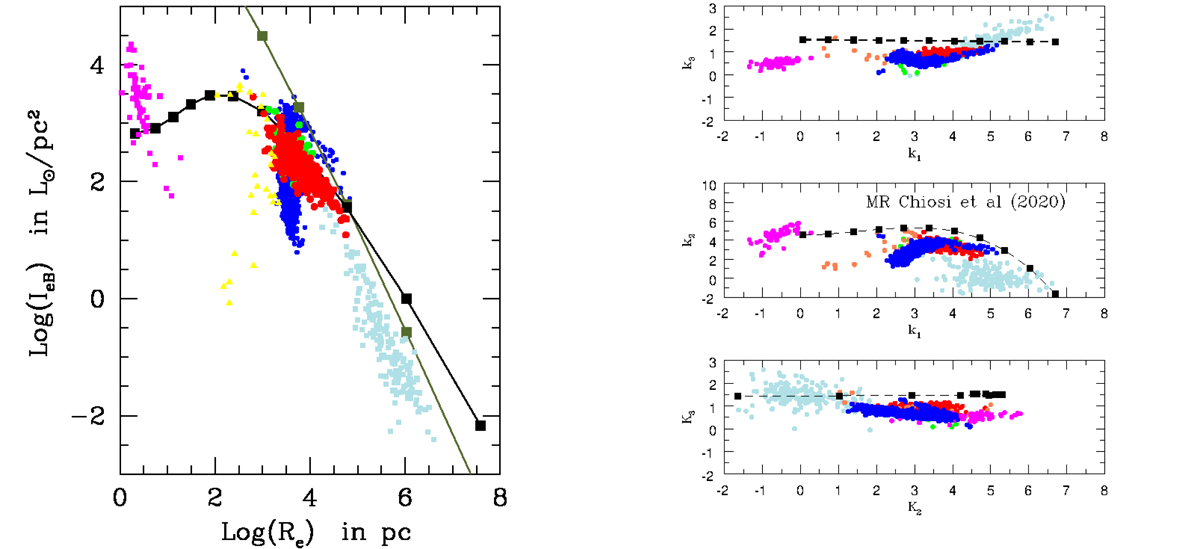
Same as in Fig. 4. Left panel: Ie-Re plane. Right panel: 3DKS. The physical assumptions for the SSP-models and meaning of the symbols are the same as in Fig. 4. The only difference here is that the duration of the star formation activity ΔTsfr is supposed to always increase with the galaxy mass (solid black lines and black filled squares). This case strictly mimics the hierarchical scheme of galaxy formation. For sake of comparison, we also plot the curve for a constantly decreasing ΔTsfr (the green solid line and green filled squares). In the first case, while the upper border of the observational data on the Ie-Re plane is still reasonably matched (but for the most massive ETGs and galaxy clusters), serious difficulties occur with the 3DKS, in particular: with the k3 vs. k1 plane, where the distributions of ETGs and the FP are not fitted at all.
Current usage metrics show cumulative count of Article Views (full-text article views including HTML views, PDF and ePub downloads, according to the available data) and Abstracts Views on Vision4Press platform.
Data correspond to usage on the plateform after 2015. The current usage metrics is available 48-96 hours after online publication and is updated daily on week days.
Initial download of the metrics may take a while.