Fig. 2.
Download original image
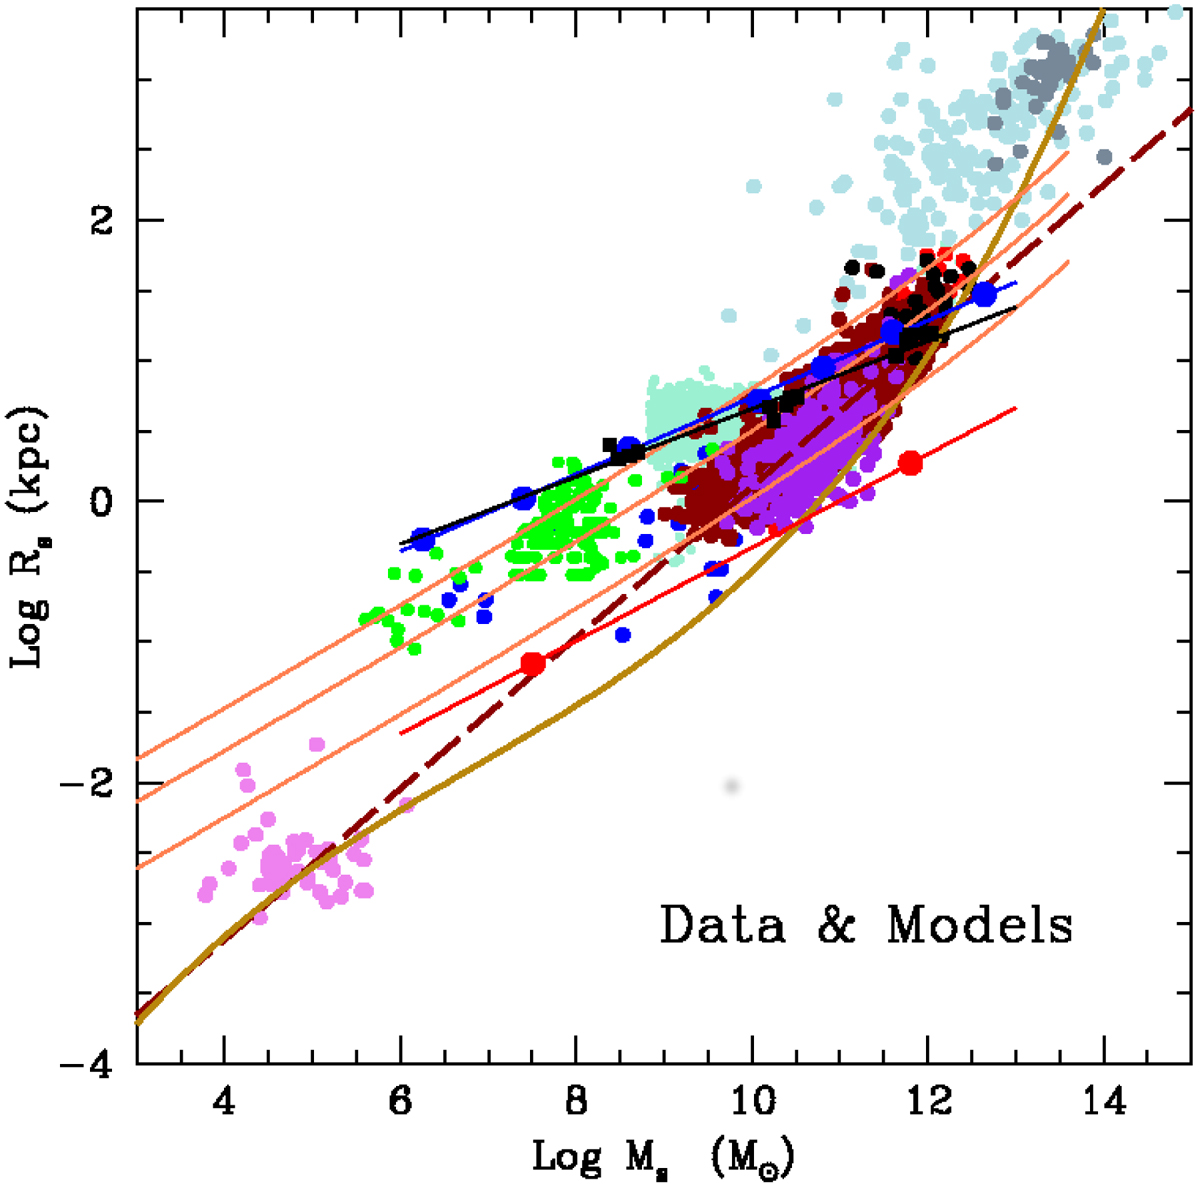
Re-Ms plane of the observational data and theoretical models adopted in this study. Data: here, we show three sources of observational data and two types of MRRs. The samples of data are: (i) Burstein et al. (1997) for GCGs (light powder-blue dots), ETGs (red dots), DGs (blue dots) together with those by Geha et al. (2006) and Woo et al. (2008; green dots), and GCs (violet dots); (ii) The Bernardi et al. (2010) data for ETGs (dark red dots) together with their best fit (the long dashed line). These ETGs fully overlap those of Burstein et al. (1997); (iii) The WINGS data for GCGs (dark grey dots), BCGs (black dots), and ETGs (purple dots). Also in this case there is full coincidence with the corresponding objects of the previous samples. MRRs: the dark goldenrod thick solid line is the Cosmic Galaxy Shepherd of Chiosi et al. (2020) at redshift z = 0; this MRR folds together the galaxy MRR expected from cosmological HDF of halos. The solid orange lines are MRRs of Fan et al. (2010) for redshift zf = 0 (top), 1, and 5 (bottom). Models: theoretical hydrodynamic models of galaxies to be compared with observational data are (i) the Illustris galaxies (light green small dots) for z = 0 that are partially masked by the observational data of ETGs; (ii) the low initial density models (blue filled circles joined by their best-fit line) and the high initial density ones (red filled circled joined by their best-fit) by Chiosi & Carraro (2002); and (iii) the early hierarchical models by Merlin et al. (2012; black squares and their best-fit). See the text for more details.
Current usage metrics show cumulative count of Article Views (full-text article views including HTML views, PDF and ePub downloads, according to the available data) and Abstracts Views on Vision4Press platform.
Data correspond to usage on the plateform after 2015. The current usage metrics is available 48-96 hours after online publication and is updated daily on week days.
Initial download of the metrics may take a while.