Fig. 12.
Download original image
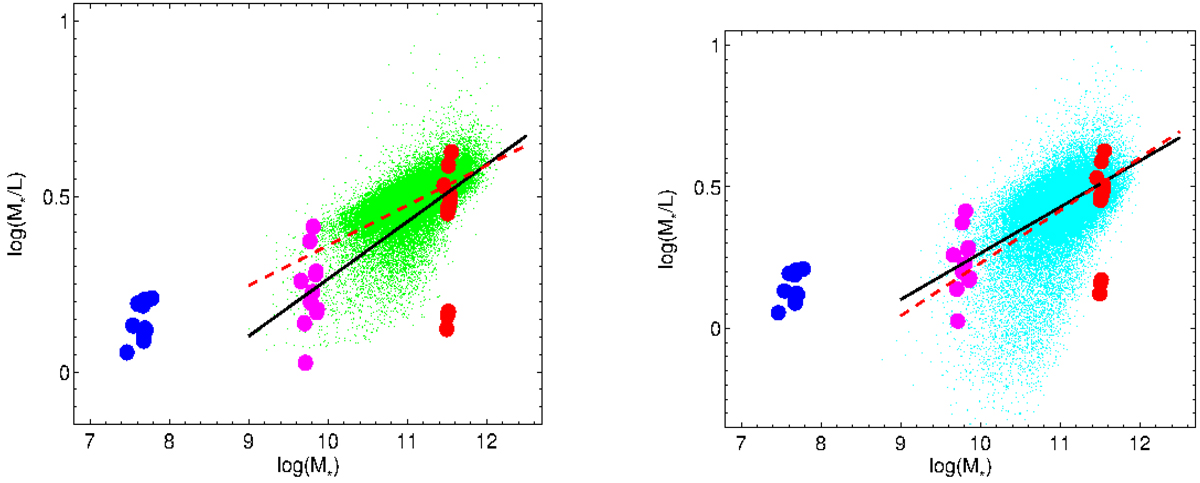
M/L vs. M projection of the FP in the SDSS r′-band, i.e. the relation log(Ms/Ls)⊙ = log(M/Lr′)⊙ vs. log Ms, where log Ms is the stellar mass enclosed within the half-light radius, in units of 1012 M⊙ and calculated according to Bell et al. (2003; left) and Gallazzi et al. (2005; right). Lr′ is the r′ luminosity enclosed within the half light radius. The small dots in both panels are the data from the catalog by Bernardi et al. (2010; priv. comm.), whose linear fit is shown as a continuous line. The big filled circles refer to our sets of models (12 models × 3 projection planes = 36 models) and the best fit of the intermediate and high mass models is shown as a dashed line. The dispersion of the models along the vertical axis, in particular for the high mass ones, is mainly due to their different initial conditions.
Current usage metrics show cumulative count of Article Views (full-text article views including HTML views, PDF and ePub downloads, according to the available data) and Abstracts Views on Vision4Press platform.
Data correspond to usage on the plateform after 2015. The current usage metrics is available 48-96 hours after online publication and is updated daily on week days.
Initial download of the metrics may take a while.