Fig. 11.
Download original image
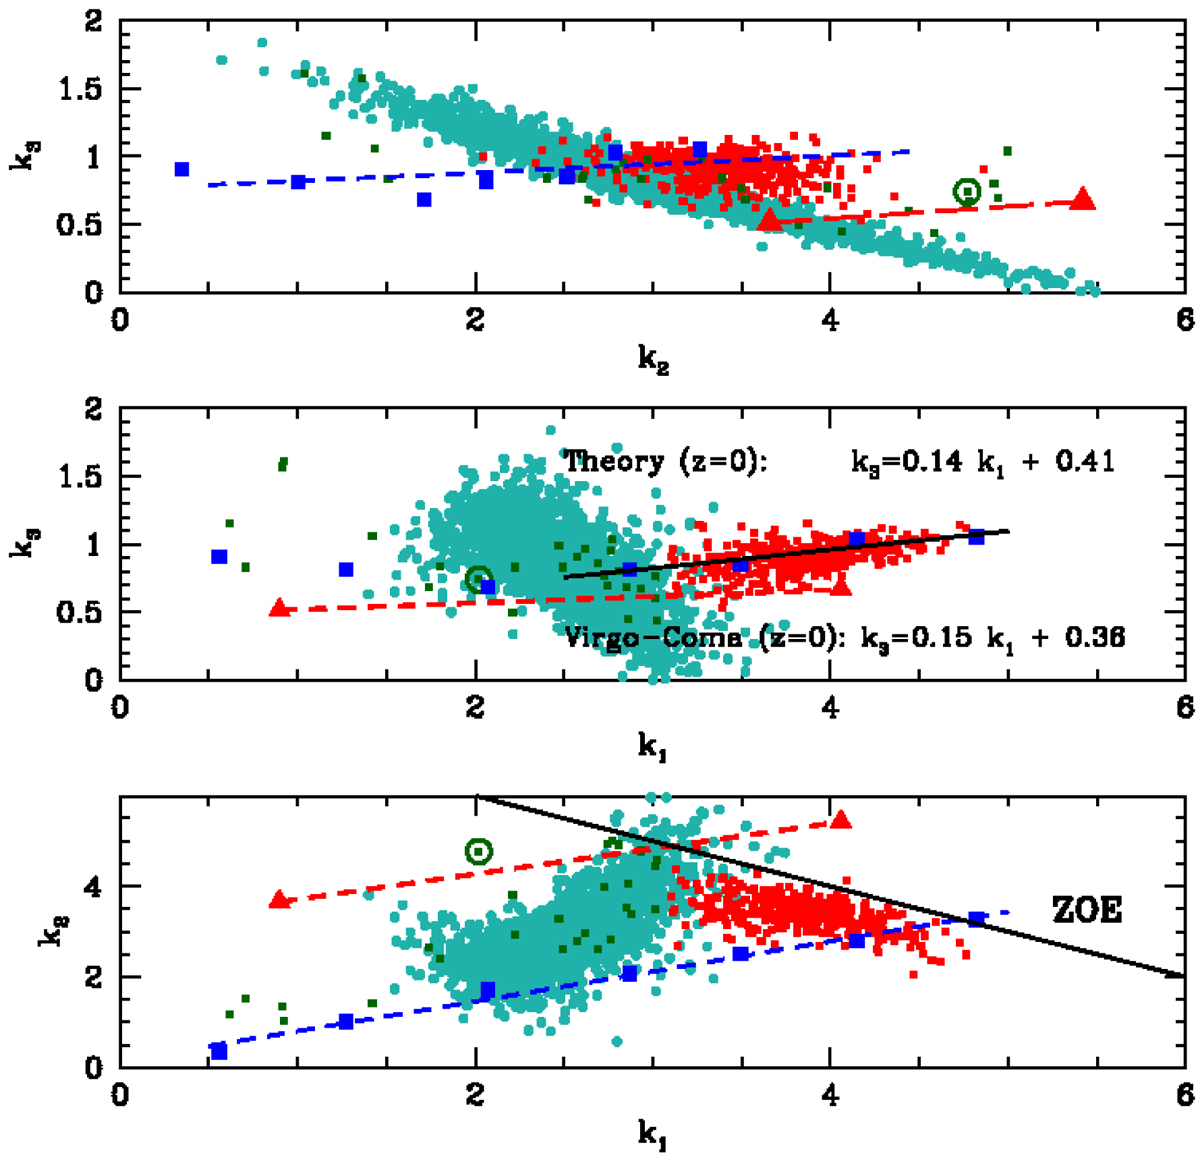
3DKS of ETGs (small red squares) and DGs (small green squares) of the Local Universe (hence, at the present age, z = 0) by Burstein et al. (1997). The data are compared with the monolithic models by Chiosi & Carraro (2002) for two formation redshifts and hence initial densities. The high initial density models (z ≃ 5) are indicated by the red triangles and the red dashed line, while the low density ones (z ≃ 1) by the blue squares and the blue dashed line. In all panels, the empty circle shows the position of M32 (NGC221). The solid black line in the k1 vs. k3 plane is the best fit of the models for ETGs, the slope of which nicely coincides with the slope of the FP for ETGs in Virgo and Coma clusters. The equations for the FP are k3 = 0.14k1 + 0.41 for the models and k3 = 0.15k1 + 0.36 for the real galaxies. The agreement if fairly good. In the background, we also show the Illustris models at z = 4 (light green dots). We note the striking difference of the galaxy distribution in the three planes at varying redshift.
Current usage metrics show cumulative count of Article Views (full-text article views including HTML views, PDF and ePub downloads, according to the available data) and Abstracts Views on Vision4Press platform.
Data correspond to usage on the plateform after 2015. The current usage metrics is available 48-96 hours after online publication and is updated daily on week days.
Initial download of the metrics may take a while.