Fig. 10.
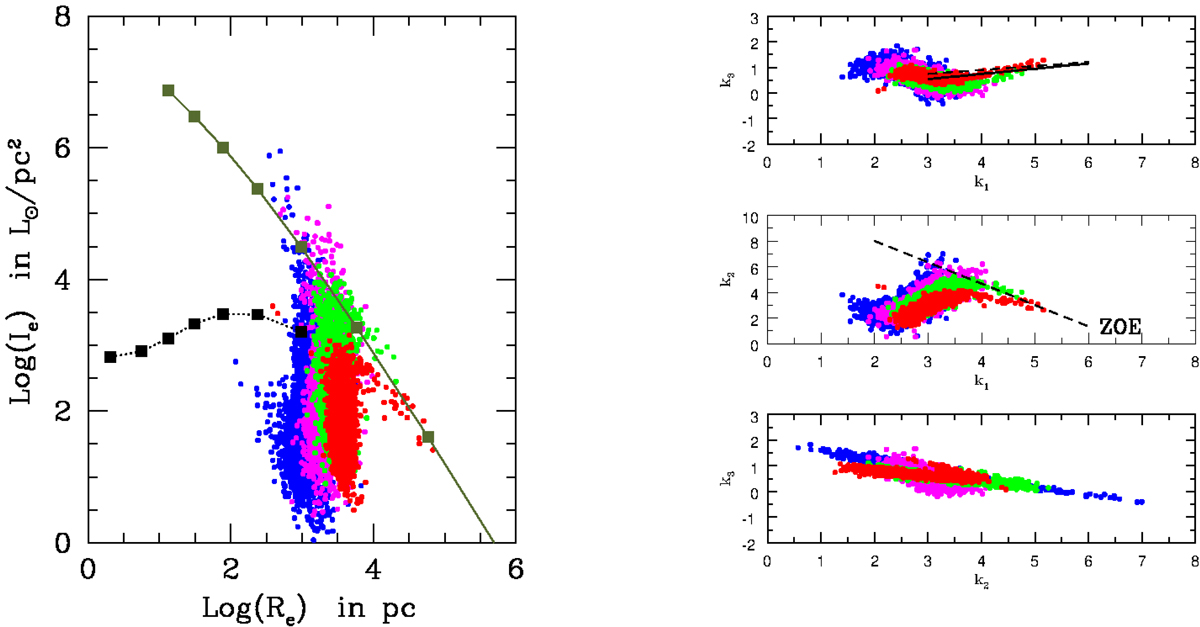
Download original image
Evolution of the Illustris galaxies on the Ie-Re plane (left panel) and the 3DKS (right panel) from z = 4 to z = 0. There are four values of the redshift with the following color code: blue (z = 4.0), magenta (z = 2), green (z = 1), and red (z = 0). In the left panel, we also display the GLO and GAL lines of the reference case. The right panel is split in three parts showing the correlations k3 vs. k1 (top), k2 vs. k1 (middle), and k3 vs. k2 (bottom). In the k3 vs. k1 plane, which shows the fundamental plane, we also plot the relation derived by Burstein et al. (1997) for ETGs in the Virgo and Coma clusters (k3 = 0.15k1 + 0.36, dashed line) and the same for the Illustris objects falling in the region of ETGs of the MR plane (k3 = 0.20k1 − 0.075, solid line). The agreement is fairly good. In the middle diagram we also plot the ZOE line given by Burstein et al. (1997) with the equation: k2 + k1 = 8.
Current usage metrics show cumulative count of Article Views (full-text article views including HTML views, PDF and ePub downloads, according to the available data) and Abstracts Views on Vision4Press platform.
Data correspond to usage on the plateform after 2015. The current usage metrics is available 48-96 hours after online publication and is updated daily on week days.
Initial download of the metrics may take a while.