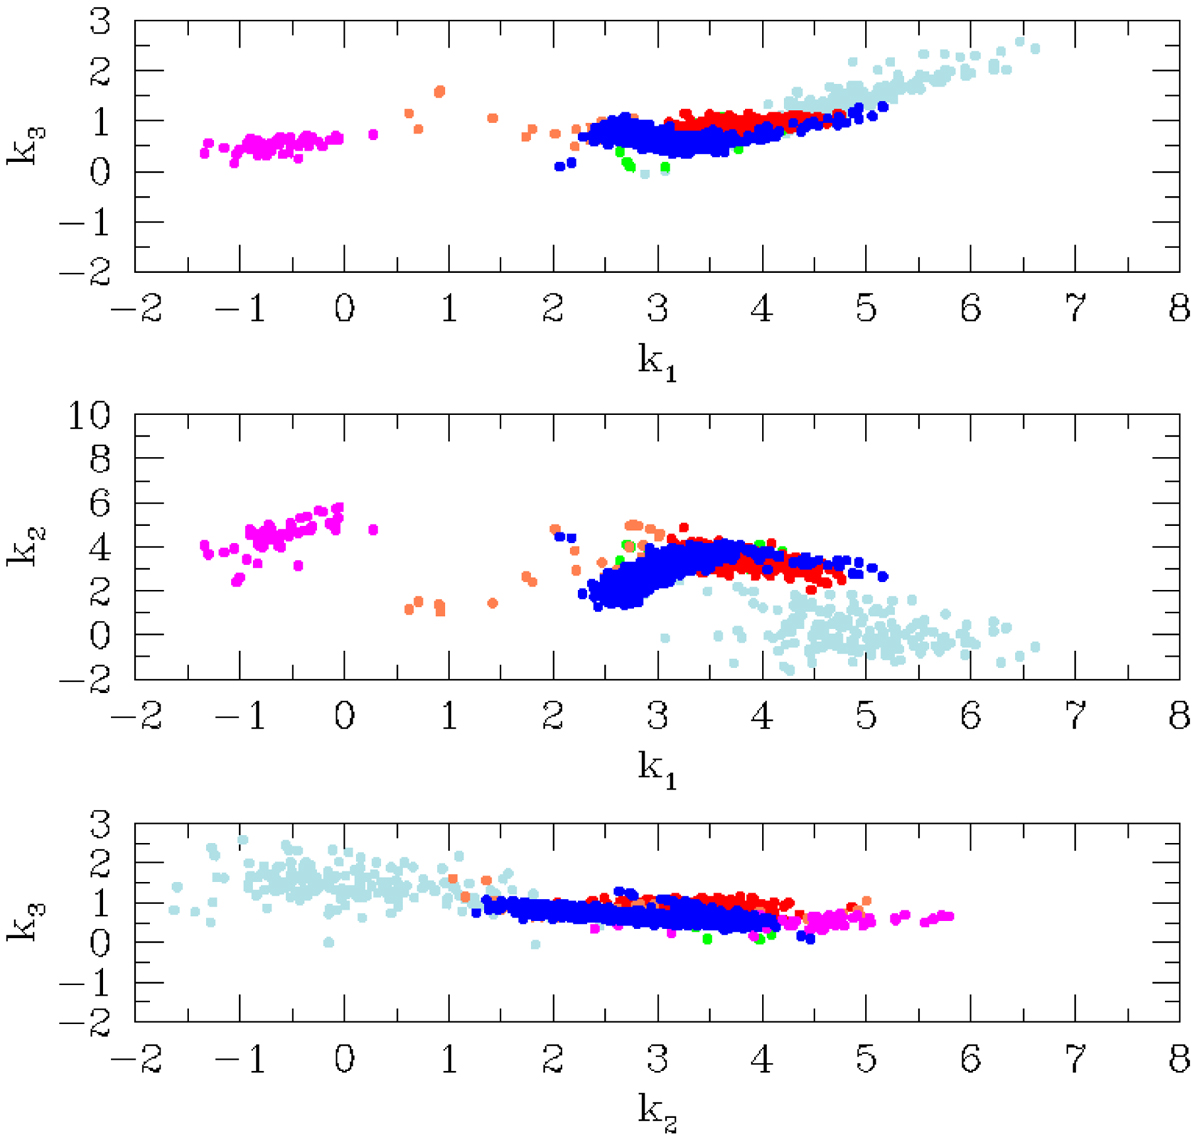
Fig. 1.
Download original image
3DKS of the Burstein et al. (1997) data and the Illustris sample. The red dots are the ETGs, the green dots the LTGs, the coral dots the DGs, the magenta dots the GCs, the light-blue dots the GCGs, and the blue dots are the Illustris galaxies. To avoid overcrowding of the panels that data of Bernardi et al. (2010) and of the WINGS survey are not plotted. They overlap the Burstein et al. (1997) data. However, it is worth recalling that the observational data of Burstein et al. (1997) are in the B-band while the Illustris models are in the V-band. Consequently, there is a systematic offset among the two groups of data. Therefore, the comparison is only of qualitative nature. Nevertheless, the Illustris models overlap the LTGs, ETGs and a large part of the DGs, implying an acceptable agreement between theory and observations.
Current usage metrics show cumulative count of Article Views (full-text article views including HTML views, PDF and ePub downloads, according to the available data) and Abstracts Views on Vision4Press platform.
Data correspond to usage on the plateform after 2015. The current usage metrics is available 48-96 hours after online publication and is updated daily on week days.
Initial download of the metrics may take a while.