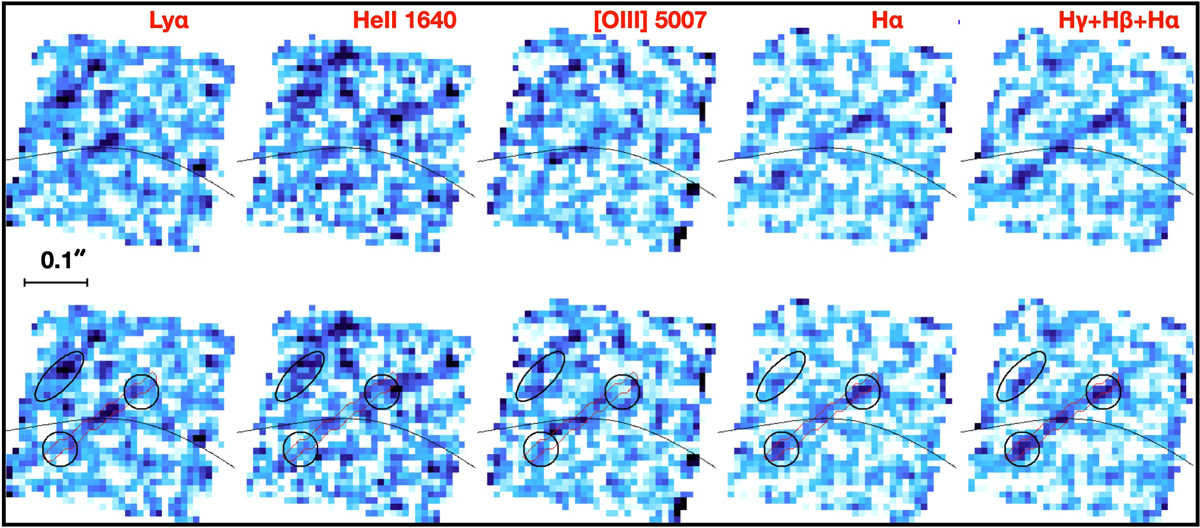
Fig. B.1.
Download original image
Two-dimensional images of the most relevant lines detected at the redshift of the arclet. From left to right, the Lyα, [O III]λ5007, Hα and the sum of the Balmer lines, Hγ, Hβ, and Hα. The first and second rows show the same images, derived after averaging three slices at the wavelength position of the lines. In the second row, the knots are labeled: the black circles highlight the components B1,2 and the ellipse marks the position of source 1. The black curve outlines the critical line of the customized lens model.
Current usage metrics show cumulative count of Article Views (full-text article views including HTML views, PDF and ePub downloads, according to the available data) and Abstracts Views on Vision4Press platform.
Data correspond to usage on the plateform after 2015. The current usage metrics is available 48-96 hours after online publication and is updated daily on week days.
Initial download of the metrics may take a while.