Fig. A.2.
Download original image
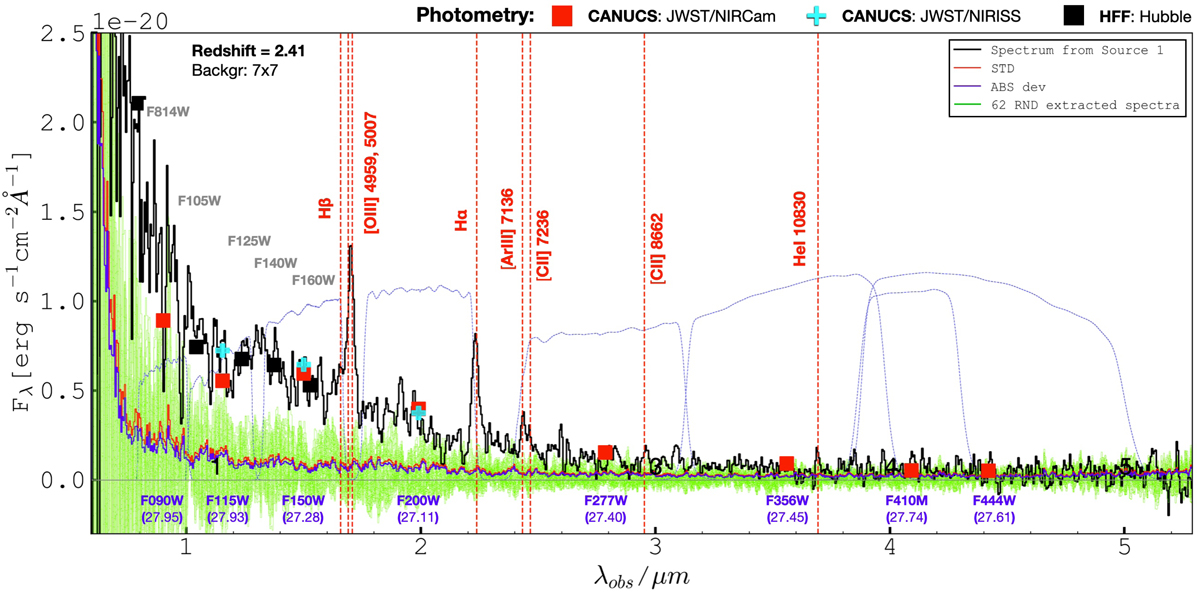
One-dimensional spectrum of Source 1 at z = 2.41 extracted from the aperture shown in Figure 1. The same aperture was used to compute the JWST/NIRcam, NIRISS, and Hubble photometry, all superimposed on this figure without applying any scaling factor. At the bottom, the filter names are indicated with the magnitudes of Source 1. The blue dashed lines show the filter throughputs. The green region shows the noise obtained from 62 spectra extracted with the same aperture size, placed randomly in the field of view. The blue and red lines show the absolute and standard deviation from the green envelope.
Current usage metrics show cumulative count of Article Views (full-text article views including HTML views, PDF and ePub downloads, according to the available data) and Abstracts Views on Vision4Press platform.
Data correspond to usage on the plateform after 2015. The current usage metrics is available 48-96 hours after online publication and is updated daily on week days.
Initial download of the metrics may take a while.