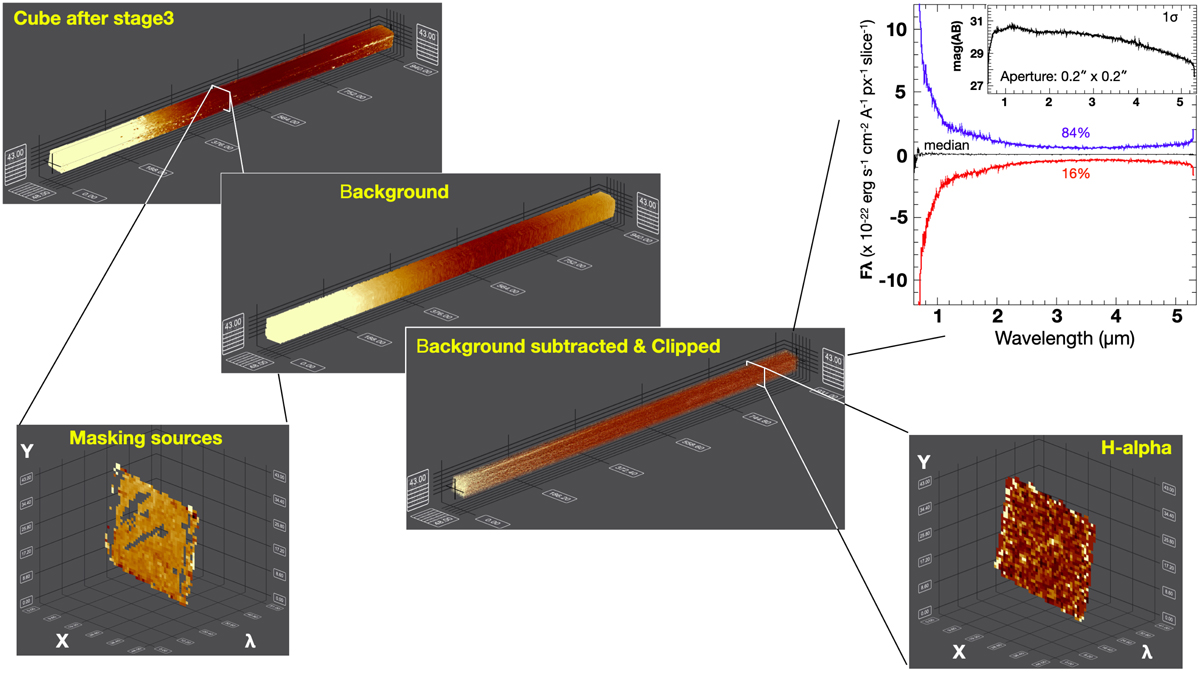
Fig. A.1.
Download original image
Scheme of the post-processing of the datacube. From top left to lower right, the reduced cube flux-calibrated in Fλ as described in Sect. 3.1, not background subtracted. Each XY plane consists of 48 by 43 spaxels (0.1″/spaxel), while 940 slices span the range 0.6 − 5.3 μm along the wavelength direction, with 1 slice sampling 50 Å. In the middle panel, the background is derived from the top left with a moving median calculated on each XY plane and removal of the outliers (see text). The bottom panel shows the background-subtracted and clipped datacube. An example of the masked sources and edges of the cube is shown in the bottom left, while the bottom right shows an extracted slice at the peak of the Hα line. In the top-right inset, the residual values per slice and the depth of the cube are reported (see details in the text).
Current usage metrics show cumulative count of Article Views (full-text article views including HTML views, PDF and ePub downloads, according to the available data) and Abstracts Views on Vision4Press platform.
Data correspond to usage on the plateform after 2015. The current usage metrics is available 48-96 hours after online publication and is updated daily on week days.
Initial download of the metrics may take a while.