Fig. 5.
Download original image
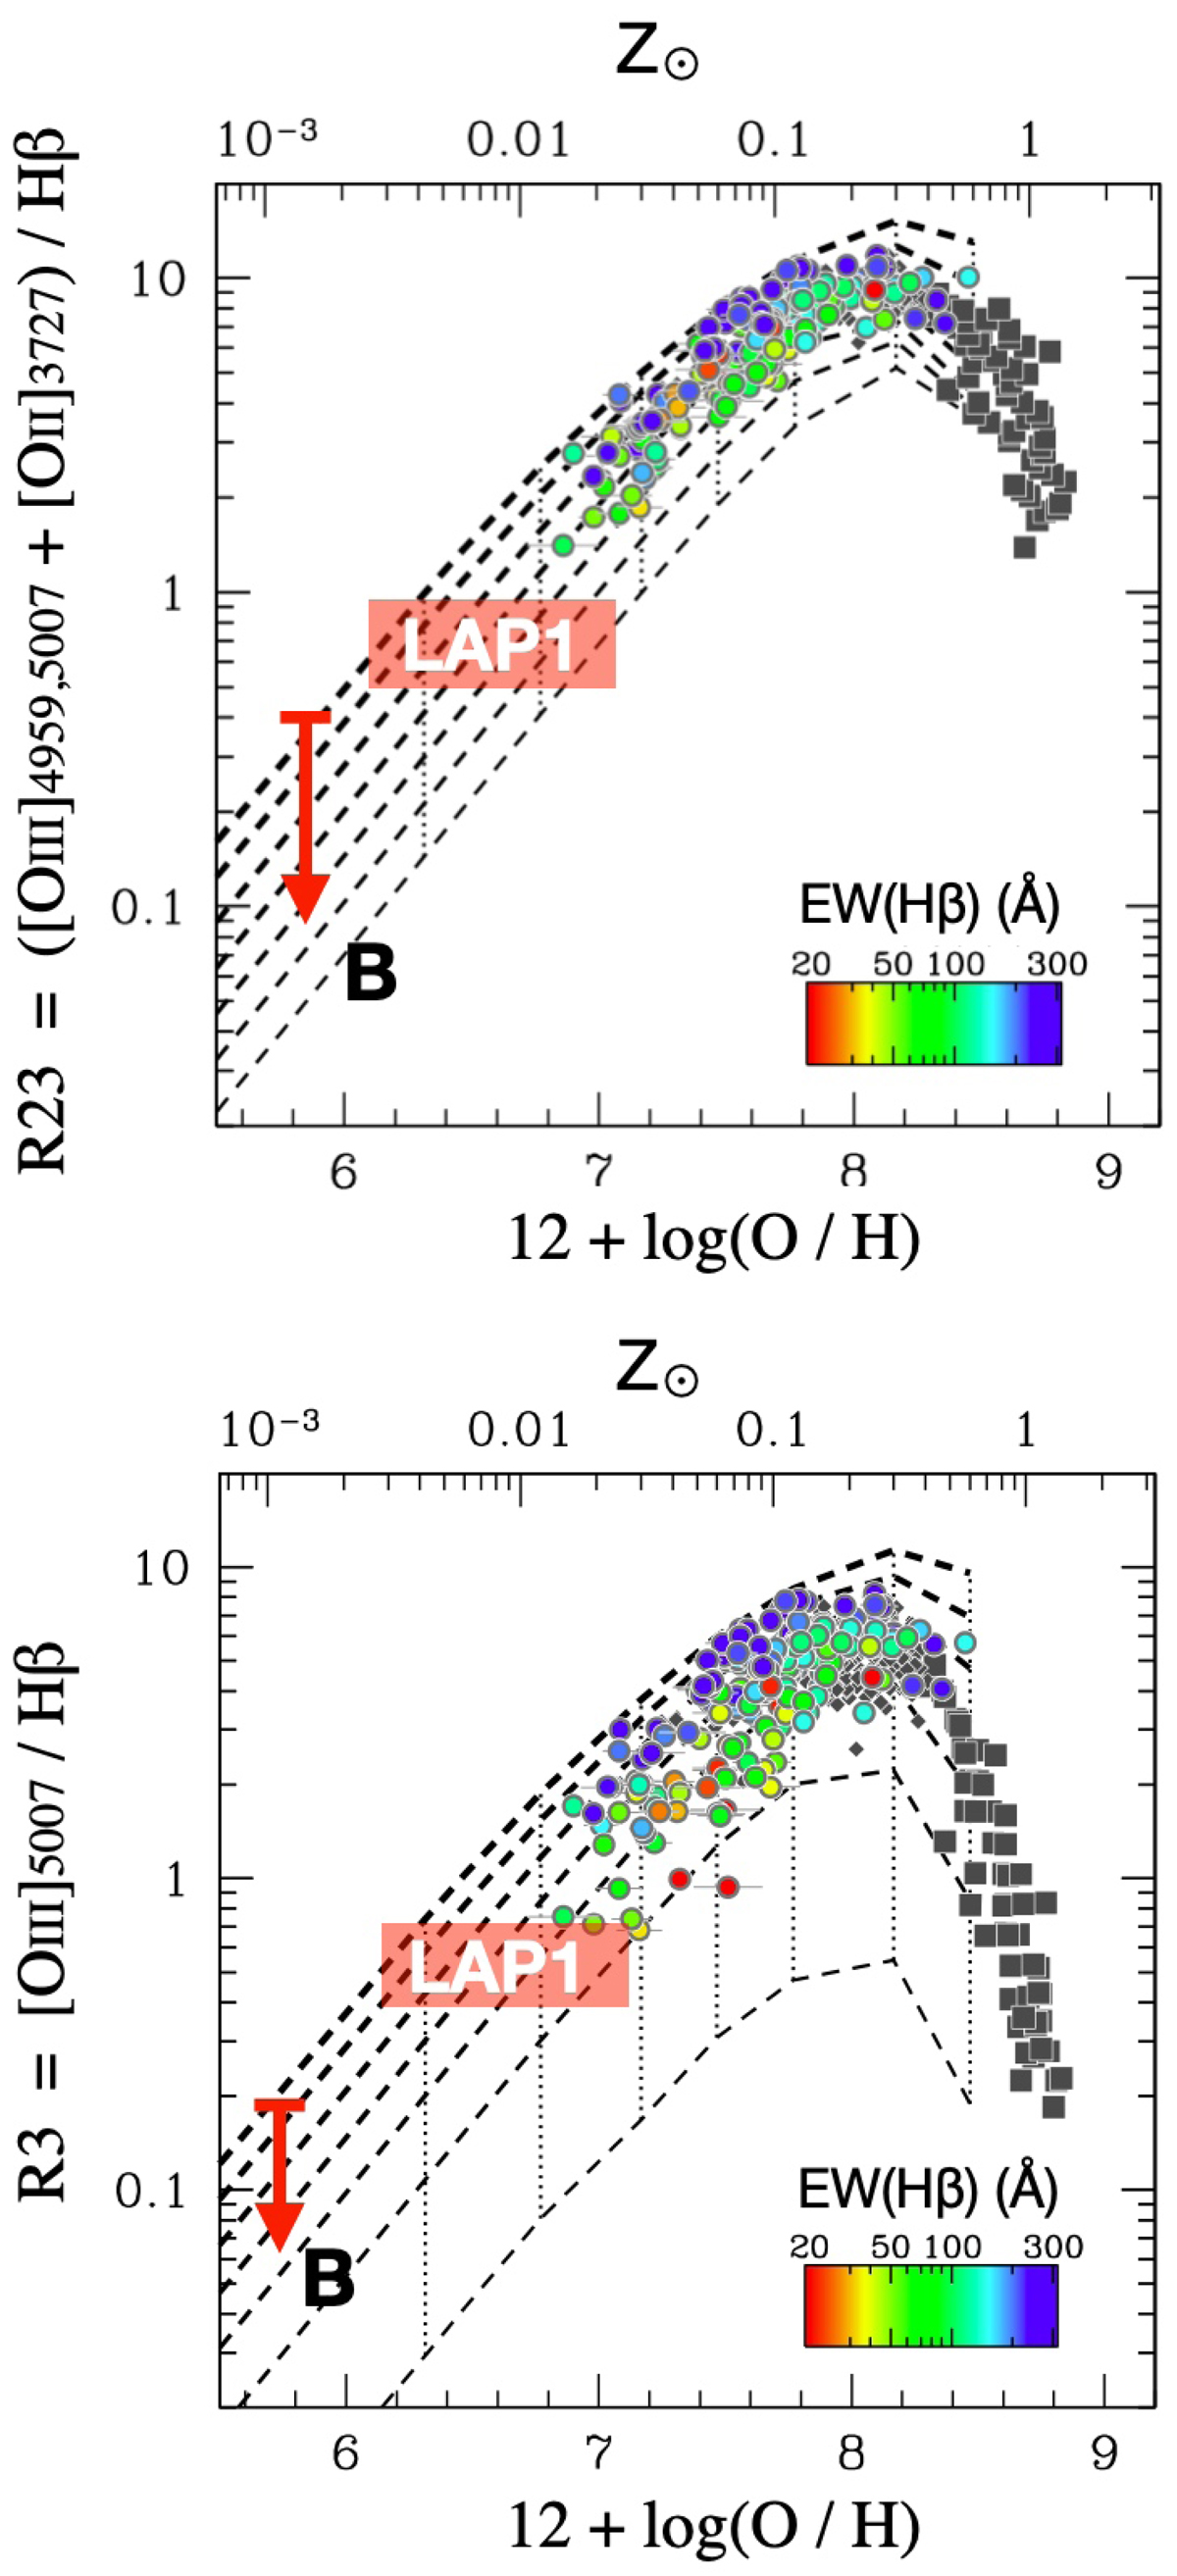
Photoionization model predictions of the R23 (top) and R3 (bottom) indexes based on the binary evolution SEDs (BPASS). The model tracks (dashed lines) span the ionization parameter log(U) from −3.5 (thin lines) to −0.5 (thick lines) with a step of 0.5 dex. The gas density is fixed to 100 cm−3. The models encompass the scatter of data points and the dependency on the EW(Hβ) by changing the ionization parameter. The datapoints are those collected by Nakajima et al. (2022) for which accurate metallicities were measured with the direct Te method (figures adapted from Nakajima et al. 2022).
Current usage metrics show cumulative count of Article Views (full-text article views including HTML views, PDF and ePub downloads, according to the available data) and Abstracts Views on Vision4Press platform.
Data correspond to usage on the plateform after 2015. The current usage metrics is available 48-96 hours after online publication and is updated daily on week days.
Initial download of the metrics may take a while.