Fig. 4.
Download original image
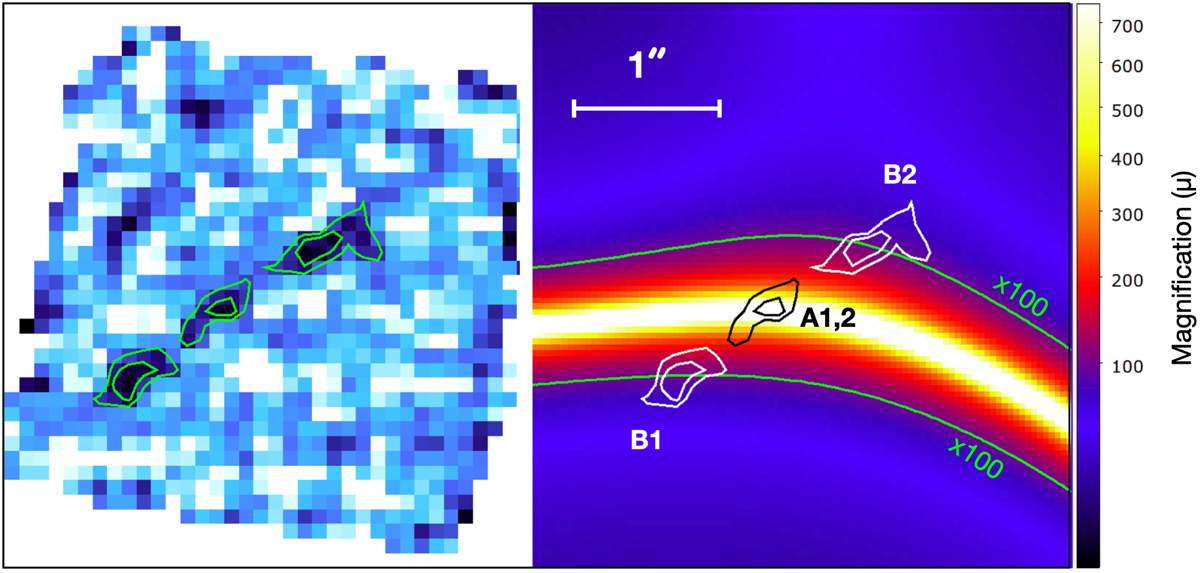
Magnification map extracted from the B23new lens model is shown in the right panel, with contours marking the stacked, triply imaged Balmer line emission produced by the A and B components (see the left panel with the same contours). The two mirrored images B1 and B2 and A1,2 are labeled on the color-coded μtot map (adopting a square root scale). The lines corresponding to μtot = 100 are also overlaid in green.
Current usage metrics show cumulative count of Article Views (full-text article views including HTML views, PDF and ePub downloads, according to the available data) and Abstracts Views on Vision4Press platform.
Data correspond to usage on the plateform after 2015. The current usage metrics is available 48-96 hours after online publication and is updated daily on week days.
Initial download of the metrics may take a while.