Fig. 3.
Download original image
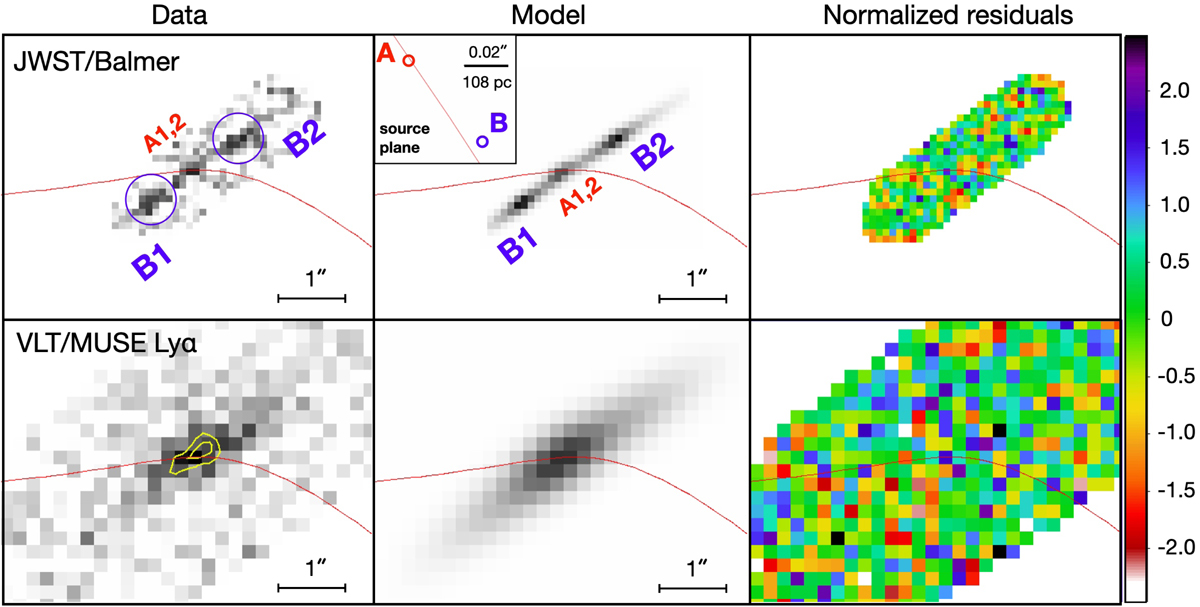
Results from the modeling of the lensed arclet LAP1 using our forward-modeling procedure. The top-left panel shows the co-added flux of the Balmer lines (Hγ + Hβ + Hα) from the NIRSpec IFS datacube, where the blue circles indicate the position of the B1,2 mirror images and the red curve is the critical line corresponding to a source redshift z = 6.64 passing through the merged A1,2 images. The top-mid panel shows the corresponding model image; the inset shows the source plane configuration of A and B, where we also indicate the physical scale and the caustic line. The top-right panel shows the normalized residuals, (Data − Model)/σ. The bottom panels similarly show the GravityFM modeling of the VLT/MUSE Lyα image, with overlaid Lyα emission contours (in yellow) obtained from the NIRSpec datacube.
Current usage metrics show cumulative count of Article Views (full-text article views including HTML views, PDF and ePub downloads, according to the available data) and Abstracts Views on Vision4Press platform.
Data correspond to usage on the plateform after 2015. The current usage metrics is available 48-96 hours after online publication and is updated daily on week days.
Initial download of the metrics may take a while.