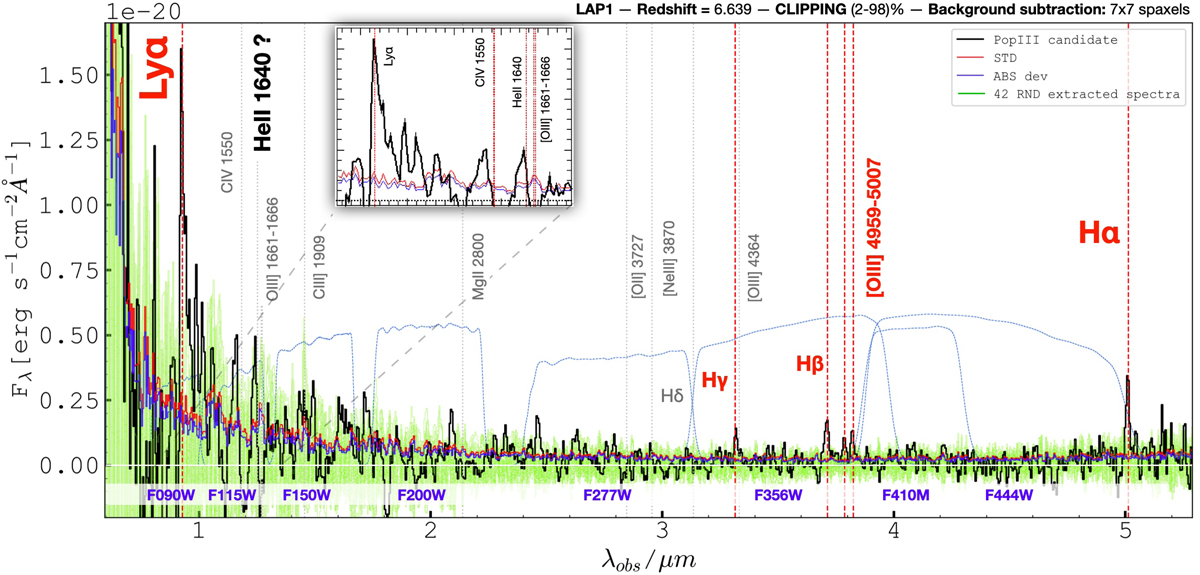
Fig. 2.
Download original image
One-dimensional NIRSpec spectrum of LAP1 (black line) extracted from the elongated aperture (“Arclet”) shown in panel 8 of Fig. 1. The most relevant lines, detected with S/N > 4, are indicated in bold red text and dashed lines. Additional undetected atomic transitions are shown with gray dotted lines at the redshift inferred from the Balmer lines, along with the uncertain He IIλ1640 detection marked in black. The green area shows the distribution of 42 spectra randomly extracted with the same aperture within the FoV. The blue and red lines show the corresponding absolute median and standard deviations, respectively. The redshift, adopted clipping threshold, and background window size used in the post-processing are given (top-right corner; see Appendix A for more details). The standard and mean absolute deviations are shown in red and blue, respectively. JWST photometric bands are outlined with blue dotted lines and are labeled at the bottom of the figure.
Current usage metrics show cumulative count of Article Views (full-text article views including HTML views, PDF and ePub downloads, according to the available data) and Abstracts Views on Vision4Press platform.
Data correspond to usage on the plateform after 2015. The current usage metrics is available 48-96 hours after online publication and is updated daily on week days.
Initial download of the metrics may take a while.