Fig. B.2.
Download original image
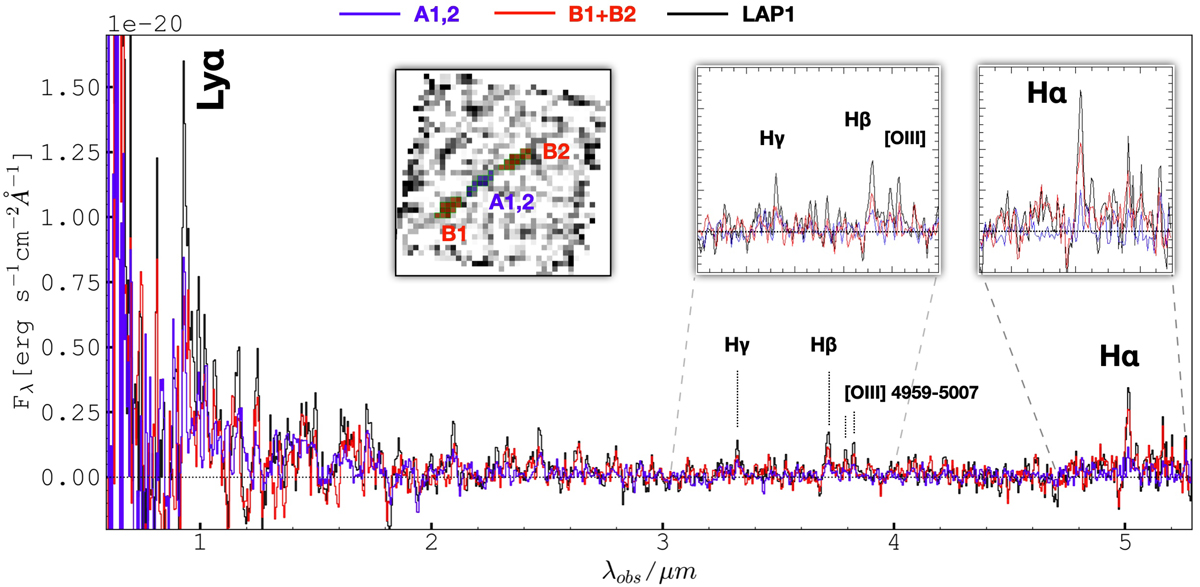
One-dimensional spectra extracted from individual components. The main arclet spectrum of LAP1 is shown in black, while the A1,2 and B1,2 in blue and red, respectively (as indicated in the title). The apertures from which the spectra of A1,2 and B1,2 were extracted are shown in the top-left inset in which the spaxels used are superimposed to the stacked image of Balmer lines (the same as shown in Figure B.1). The top-right insets show the zoomed regions, indicated with gray-dashed lines.
Current usage metrics show cumulative count of Article Views (full-text article views including HTML views, PDF and ePub downloads, according to the available data) and Abstracts Views on Vision4Press platform.
Data correspond to usage on the plateform after 2015. The current usage metrics is available 48-96 hours after online publication and is updated daily on week days.
Initial download of the metrics may take a while.