Fig. 1.
Download original image
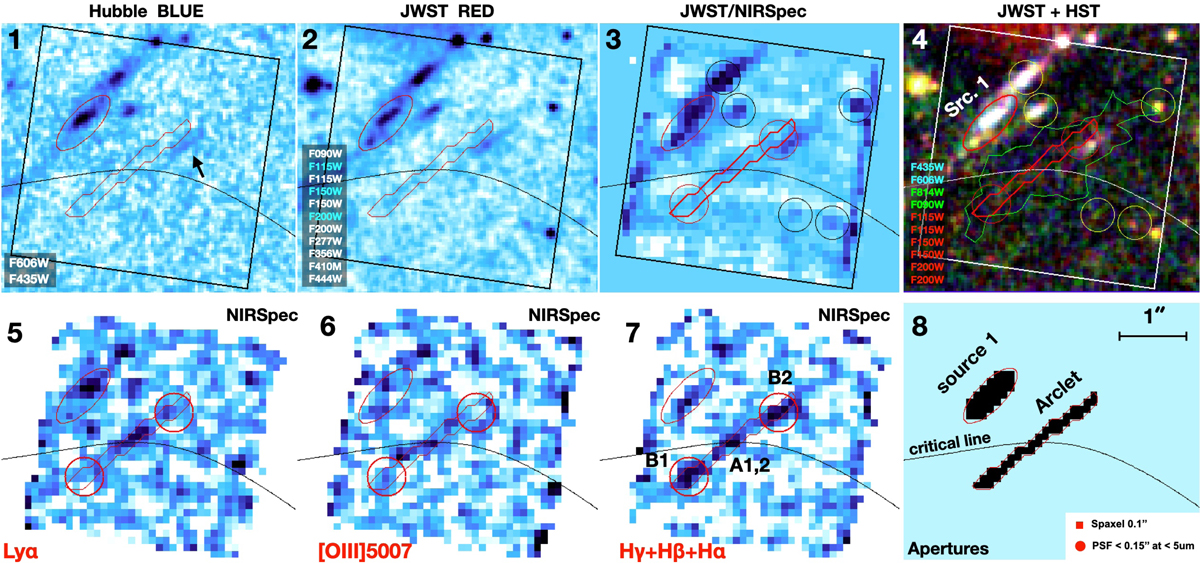
Photometric and spectroscopic observations of LAP1. Hubble Frontier Fields (Lotz et al. 2017) and JWST NIRISS NIRCam imaging from the CANUCS GTO program (Willott et al. 2022). From top left to bottom right: (1) the combined HST F435W and F606W image probing λ < 915 Å at z = 6.639. The black arrow indicates the presence of a foreground object, which is nevertheless not significantly contaminating the extracted spectrum of LAP1; (2) the 11 stacked bands from JWST/NIRCam and NIRISS, as labeled in the bottom left (white and cyan labeled filters indicate NIRCam and NIRISS, respectively); (3) the median collapse of the entire NIRSpec datacube spanning the range 0.7 − 5.2 μm (black circles indicate sources visible in the JWST and HST imaging); (4) the color composite image with the three channels blue, green, and red as indicated in the legend on the left (we note that the red channel shows the 6 stacked bands F115W, F150W, and F200W combined from NIRISS and NIRCam). The white square marks the NIRSpec FoV. The yellow circles mark the same objects as in panel 3 and the green contour outlines the 3σ Lyα from VLT/MUSE; (5)–(7) show the Lyα, [O III]λ5007, and the sum Hγ + Hβ + Hα, with the critical line (in black) and the positions of the two B1,2 components (marked with red circles), respectively; (8) shows the masks used to extract the spectra from the sources described in the text. The elongated red contour of 2.3″ × 0.2″ outlines the aperture used to extract the spectrum of the arclet (LAP1), defined on the combined image of the Balmer lines (see Appendix B), while the ellipse indicates the aperture used to extract the spectrum shown in Fig. A.2 and the magnitudes of Source 1 (z = 2.41; see Appendix A). All panels have the same scale, indicated in panel 8. The angular size of the single spaxel and the PSF at 5 μm are reported in the bottom-right inset of panel 8.
Current usage metrics show cumulative count of Article Views (full-text article views including HTML views, PDF and ePub downloads, according to the available data) and Abstracts Views on Vision4Press platform.
Data correspond to usage on the plateform after 2015. The current usage metrics is available 48-96 hours after online publication and is updated daily on week days.
Initial download of the metrics may take a while.