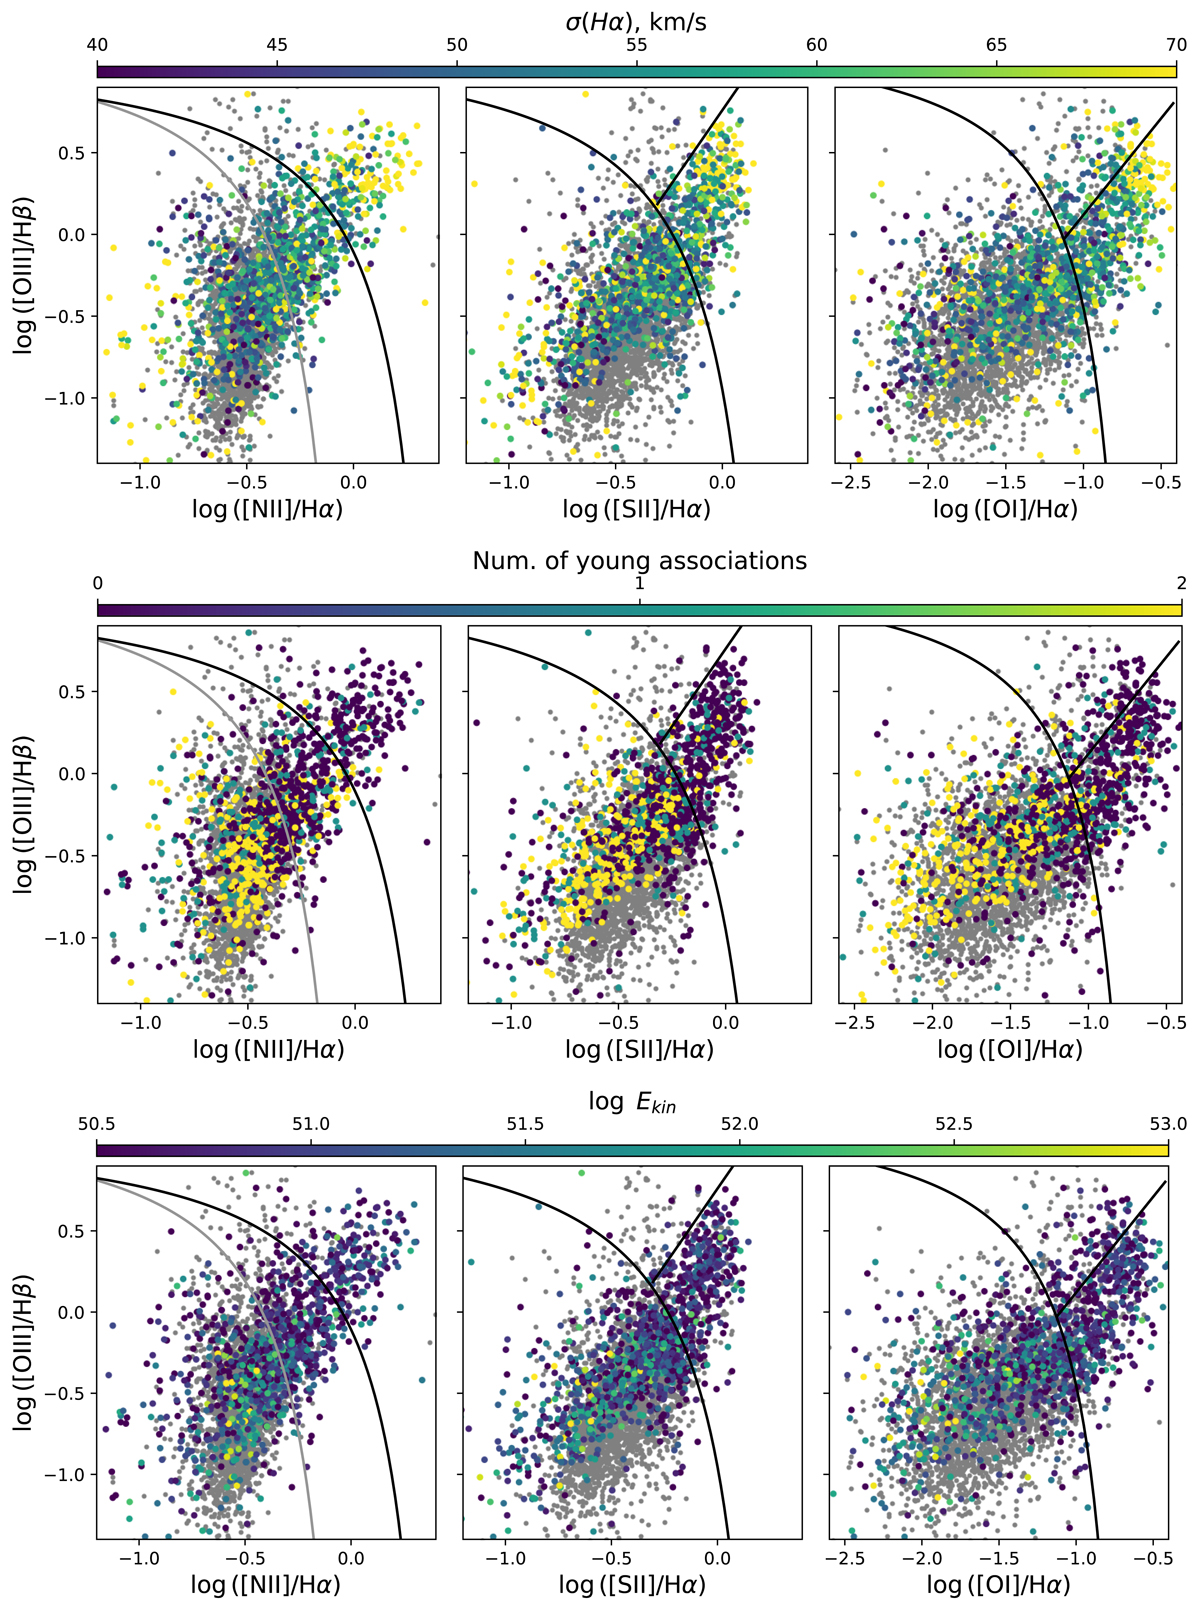
Fig. 9.
Download original image
Diagnostic BPT diagrams showing the optical line ratios for all identified regions of locally elevated velocity dispersion (colour-coded circles). Colour denotes either Hα velocity dispersion (top panels), number of young stellar associations and star clusters within the region (middle panels) or estimated kinetic energy of the gas (bottom panels). For reference, we show as grey circles nebulae from the PHANGS-MUSE catalogue (including H II regions, supernovae remnants, planetary nebulae; see Groves et al. 2023) excluding those falling in the masked areas (see Sect. 3.1). Demarcation lines separate areas on the diagrams typically occupied by regions with different excitation mechanisms: the black solid curve from Kewley et al. (2001) separates H II regions from those with a dominant contribution from other excitation mechanisms (e.g., DIG, shocks); composite mechanism of excitation is probable in the area between this and the grey curve from Kauffmann et al. (2003); AGNs usually occupy the area above the black straight line from Kewley et al. (2006).
Current usage metrics show cumulative count of Article Views (full-text article views including HTML views, PDF and ePub downloads, according to the available data) and Abstracts Views on Vision4Press platform.
Data correspond to usage on the plateform after 2015. The current usage metrics is available 48-96 hours after online publication and is updated daily on week days.
Initial download of the metrics may take a while.