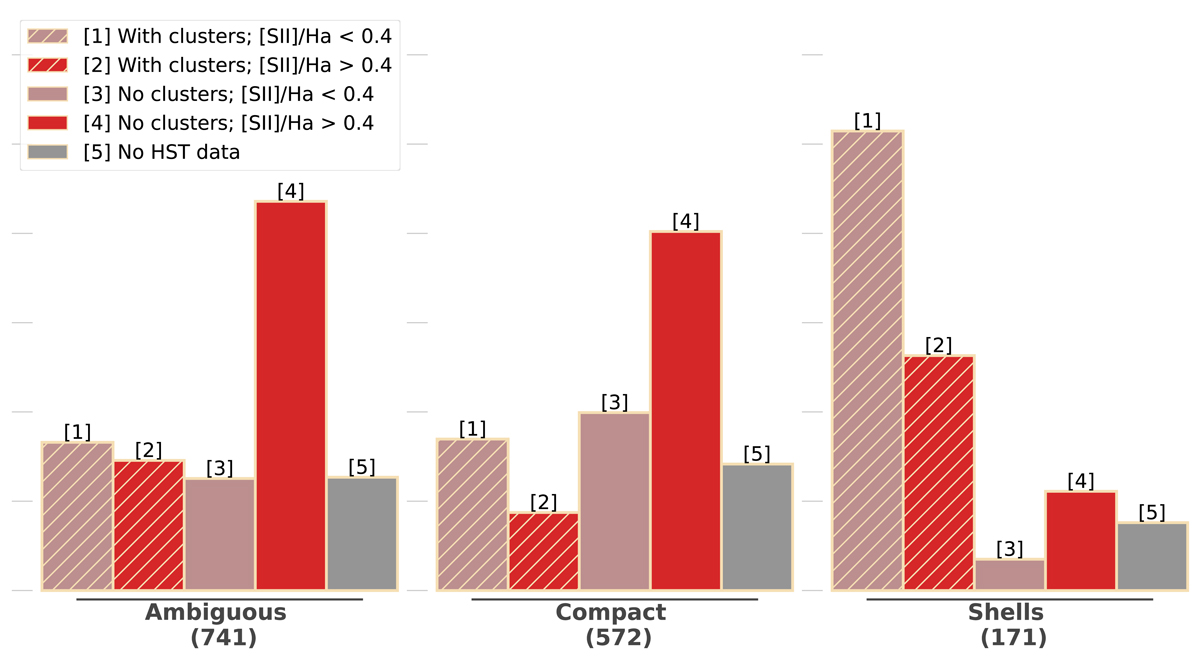
Fig. 8.
Download original image
Relative distribution of the number of regions with different morphological types, ionisation states and associated young stellar associations. Three groups are shown, corresponding to the three morphological types (see text in Sect. 4.1), and their sizes correlate with the relative number of corresponding regions. Different colours correspond to select properties: red and orange colours correspond to regions with [S II]/Hα > 0.4, while blue and green – to those with [S II]/Hα < 0.4; regions that have at least one stellar association within their borders are shown by blue and orange colours, while green and red correspond to those without identified young stars). Violet colour corresponds to the regions outside the HST footprint (and thus without information about star clusters there). Grey lines mark each 10% level.
Current usage metrics show cumulative count of Article Views (full-text article views including HTML views, PDF and ePub downloads, according to the available data) and Abstracts Views on Vision4Press platform.
Data correspond to usage on the plateform after 2015. The current usage metrics is available 48-96 hours after online publication and is updated daily on week days.
Initial download of the metrics may take a while.