Fig. 7.
Download original image
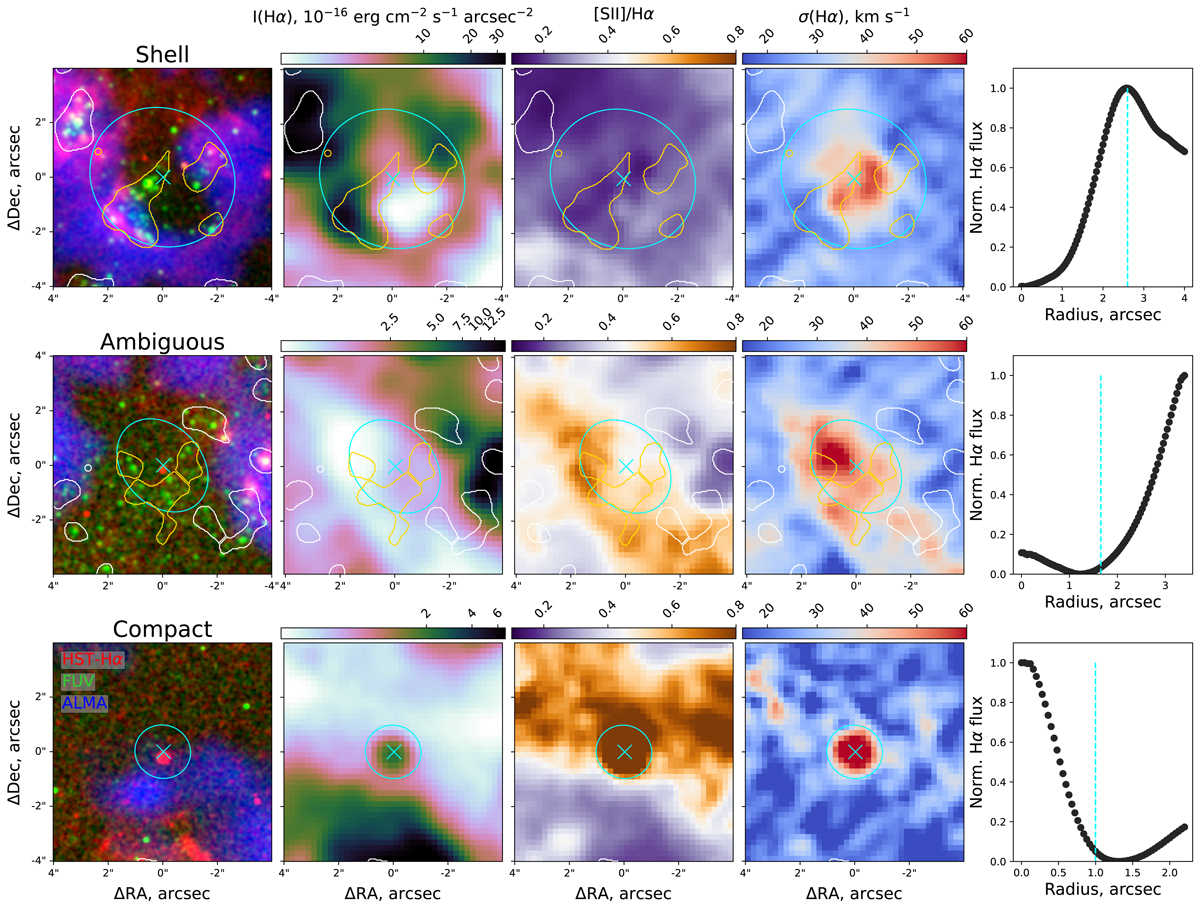
Examples of regions classified as shells (top row), ambiguous (middle row) and compact (bottom row). Images from left to right correspond to a three-colour multiband image of the region (Hα image from HST (PI: R. Chandar, GO-10402) is in red, FUV from AstroSat (Hassani et al., in prep.) in green, CO from ALMA (Leroy et al. 2021, in blue), the Hα flux distribution, the [S II]/Hα line ratio, and the Hα velocity dispersion. Cyan ellipses show the adopted borders of the region and overlaid contours correspond to the stellar associations’ masks. The HST stellar associations shown in yellow are selected as associated with the region. The right-hand plots show the radial Hα flux distribution relative to the centre of each region (marked by crosses).
Current usage metrics show cumulative count of Article Views (full-text article views including HTML views, PDF and ePub downloads, according to the available data) and Abstracts Views on Vision4Press platform.
Data correspond to usage on the plateform after 2015. The current usage metrics is available 48-96 hours after online publication and is updated daily on week days.
Initial download of the metrics may take a while.