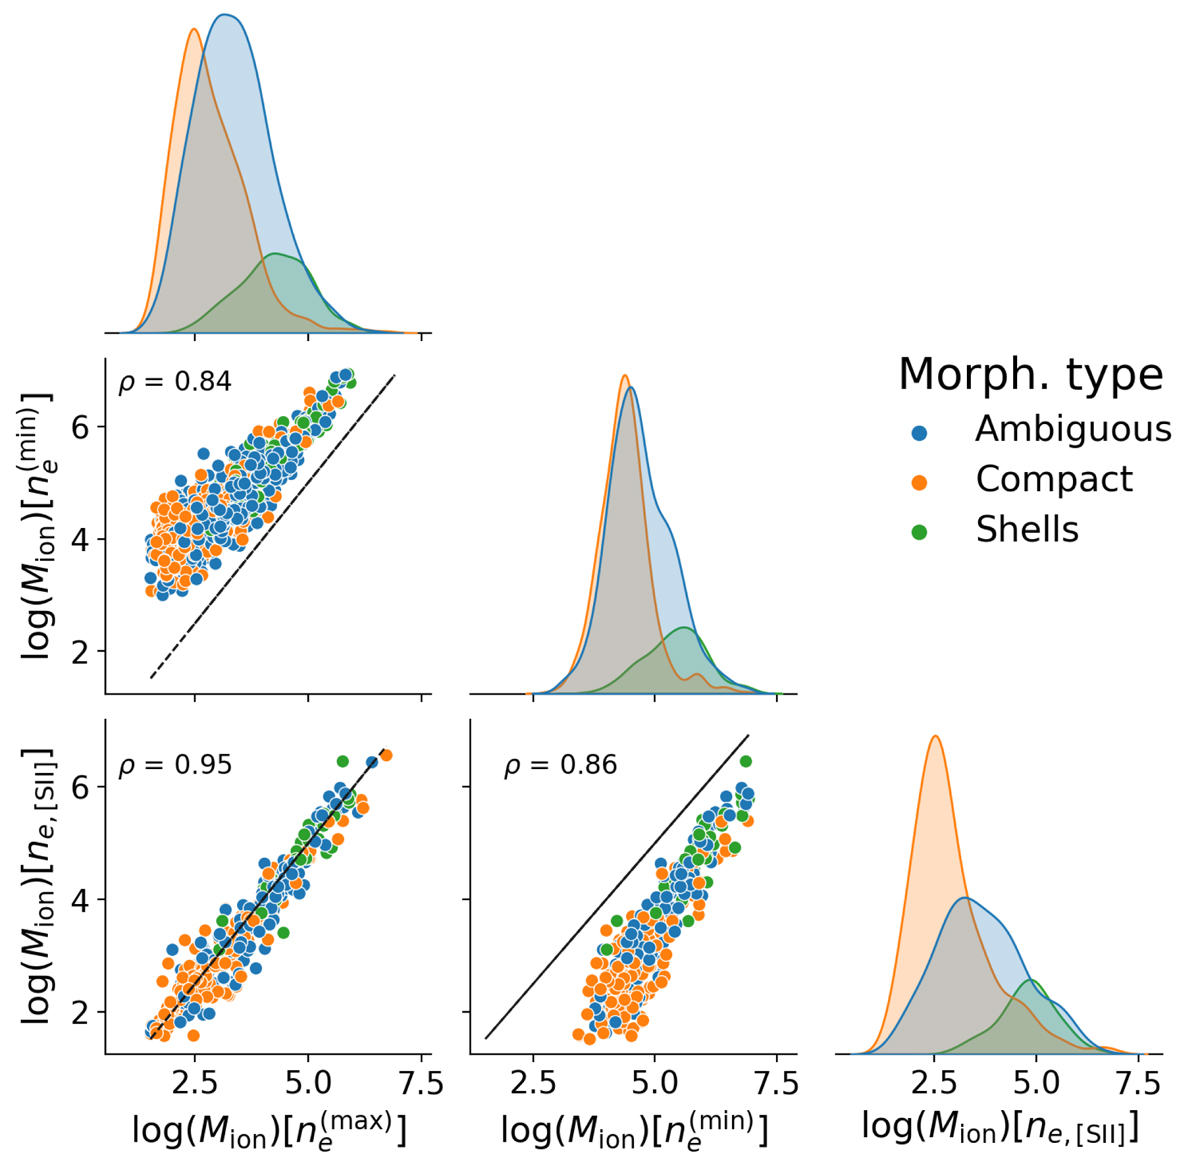
Fig. 5.
Download original image
Mass of the ionised gas in the selected regions assuming different prescriptions for electron density: lower limit (![]() ) and upper limit (
) and upper limit (![]() ) derived from the reference H II regions using Eq. (6) and from R[S II] = [S II]λ6717Å/[S II]λ6731Å flux ratio, respectively, and ne, SII derived from R[S II] of the observed spectra of the region itself. Different morphological types introduced in Sect. 4.1 are shown by different colours. Diagonal lines show 1-to-1 relation. Spearman correlation coefficients ρ are given on the plots.
) derived from the reference H II regions using Eq. (6) and from R[S II] = [S II]λ6717Å/[S II]λ6731Å flux ratio, respectively, and ne, SII derived from R[S II] of the observed spectra of the region itself. Different morphological types introduced in Sect. 4.1 are shown by different colours. Diagonal lines show 1-to-1 relation. Spearman correlation coefficients ρ are given on the plots.
Current usage metrics show cumulative count of Article Views (full-text article views including HTML views, PDF and ePub downloads, according to the available data) and Abstracts Views on Vision4Press platform.
Data correspond to usage on the plateform after 2015. The current usage metrics is available 48-96 hours after online publication and is updated daily on week days.
Initial download of the metrics may take a while.