Fig. 4.
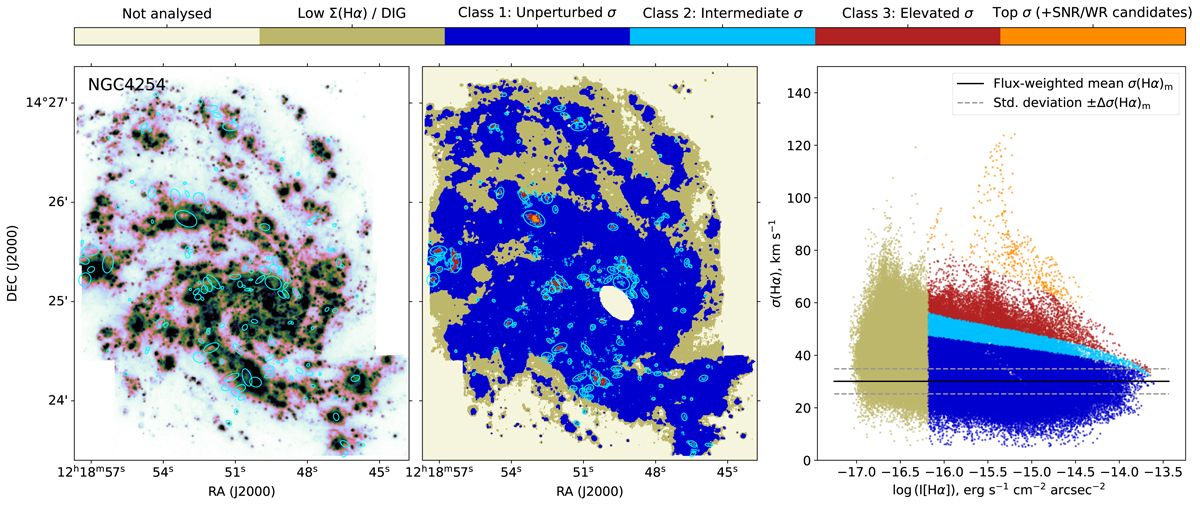
Download original image
Localisation of the regions of locally elevated Hα velocity dispersion (cyan ellipses) in NGC 4254 galaxy, identified based on the ‘intensity – velocity dispersion’ (I − σ) diagnostics, overlaid on the Hα surface brightness map (left panel) and the classification map (central panel; see text). The I − σ diagram is shown in the right panel. The black solid line shows the mean value of σ(Hα) in the galaxy, and the dashed grey lines show its 1σ uncertainty. See Fig. A.1 for the rest of the PHANGS-MUSE galaxies.
Current usage metrics show cumulative count of Article Views (full-text article views including HTML views, PDF and ePub downloads, according to the available data) and Abstracts Views on Vision4Press platform.
Data correspond to usage on the plateform after 2015. The current usage metrics is available 48-96 hours after online publication and is updated daily on week days.
Initial download of the metrics may take a while.