Fig. 3.
Download original image
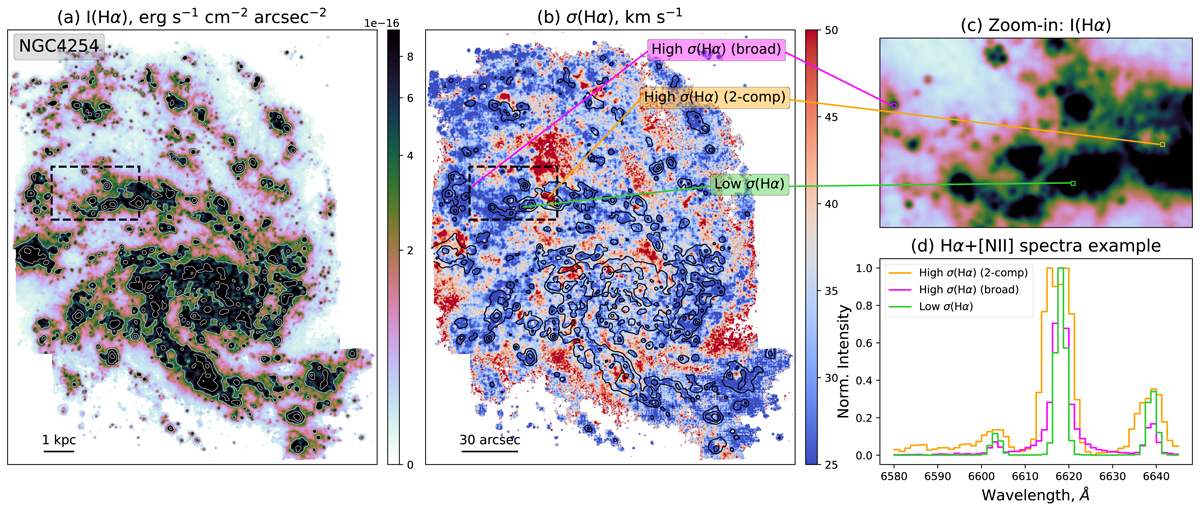
istribution of the Hα surface brightness (panel a) and velocity dispersion (panel b) for NGC 4254 shown as an example. Contours on these panels are the same and correspond to the lines of a constant Hα brightness. Panel c demonstrates a zoom-in Hα map of the area shown by dashed rectangle in panels a, b with the same brightness limits as in panel a. As follows from panel b, velocity dispersion tends to be higher in the low surface brightness regions (dominated by DIG), but there are also areas of elevated σ(Hα) towards the bright regions. Panel d shows the examples of the Hα and [N II] λ6548, 6584 Å line profiles extracted from three regions with low (green line) and high (orange and magenta lines) Hα velocity dispersion. These line profiles corresponding to high σ(Hα) are either broadened (magenta line) or can be decomposed by two components (orange line). Exact areas of the spectra extraction (3 × 3 pixels) are shown on panel c by squares of the same colour as the spectra.
Current usage metrics show cumulative count of Article Views (full-text article views including HTML views, PDF and ePub downloads, according to the available data) and Abstracts Views on Vision4Press platform.
Data correspond to usage on the plateform after 2015. The current usage metrics is available 48-96 hours after online publication and is updated daily on week days.
Initial download of the metrics may take a while.