Fig. 2.
Download original image
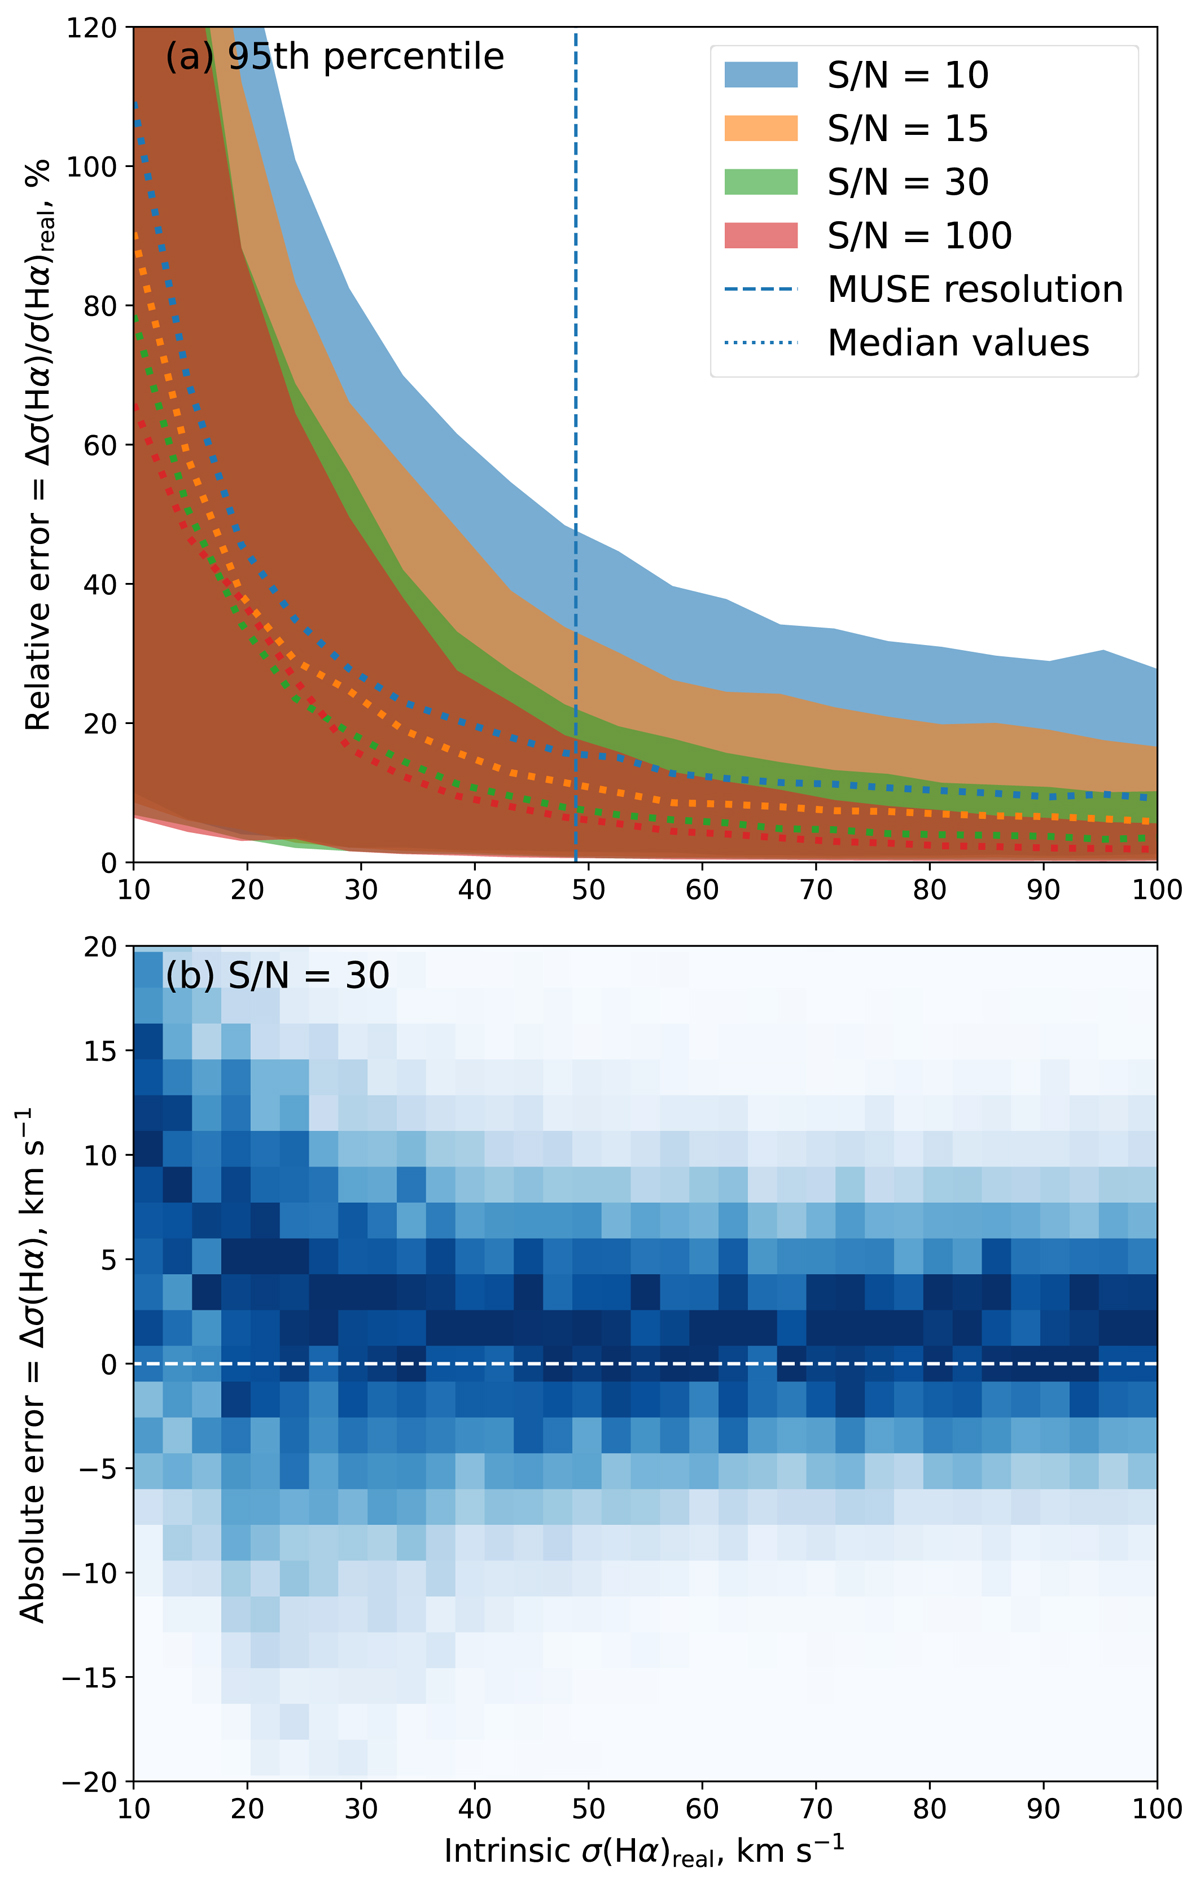
Relation between the recovered σ(Hα) and the true σ(Hα) depending on the S/N. Panel a: relative errors for various S/N. Coloured areas encompass the 5th–95th percentile interval and dotted lines trace the median values. Panel b: probability density of absolute errors for S/N = 30. The adopted MUSE resolution at the wavelength of Hα is FWHM = 2.54 ± 0.1 Å (according to Bacon et al. 2017, but with twice larger scatter; vertical dashed line on panel a).
Current usage metrics show cumulative count of Article Views (full-text article views including HTML views, PDF and ePub downloads, according to the available data) and Abstracts Views on Vision4Press platform.
Data correspond to usage on the plateform after 2015. The current usage metrics is available 48-96 hours after online publication and is updated daily on week days.
Initial download of the metrics may take a while.