Fig. 18.
Download original image
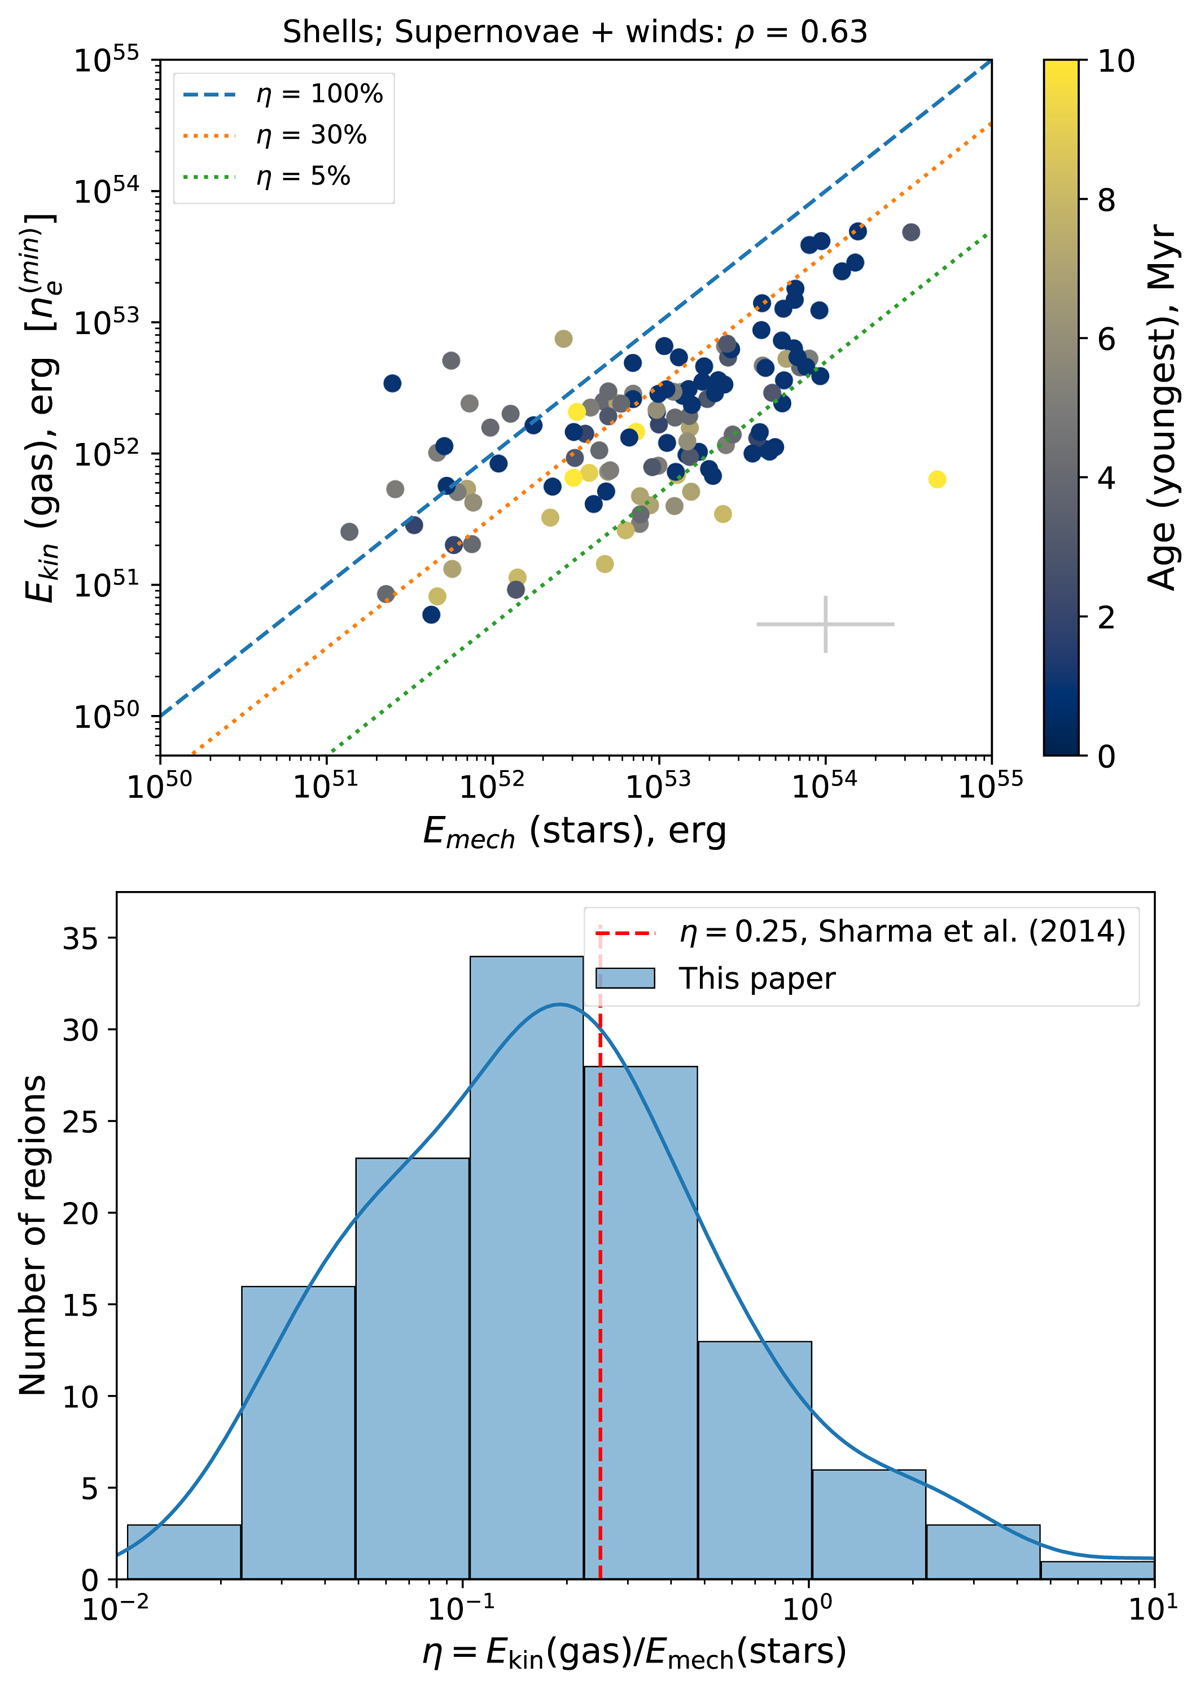
Comparison of the kinetic energy of ionised gas and the mechanical energy input by young stars for our best candidate superbubbles (as exhibiting shell-like morphology). Top plot: same comparison of energies as in Fig. 16, superbubbles follow the same trend as the other regions. Colour encodes the age of the youngest association in the superbubble. Bottom plot: distribution of the estimated efficiency of the energy consumption in superbubbles. Its peak is slightly below η = 0.25 that was obtained from the modelling by Sharma et al. (2014) as an asymptotic value for the expanding superbubbles driven by multiple (up to a few hundred) OB stars in normal star-forming galaxies.
Current usage metrics show cumulative count of Article Views (full-text article views including HTML views, PDF and ePub downloads, according to the available data) and Abstracts Views on Vision4Press platform.
Data correspond to usage on the plateform after 2015. The current usage metrics is available 48-96 hours after online publication and is updated daily on week days.
Initial download of the metrics may take a while.