Fig. 16.
Download original image
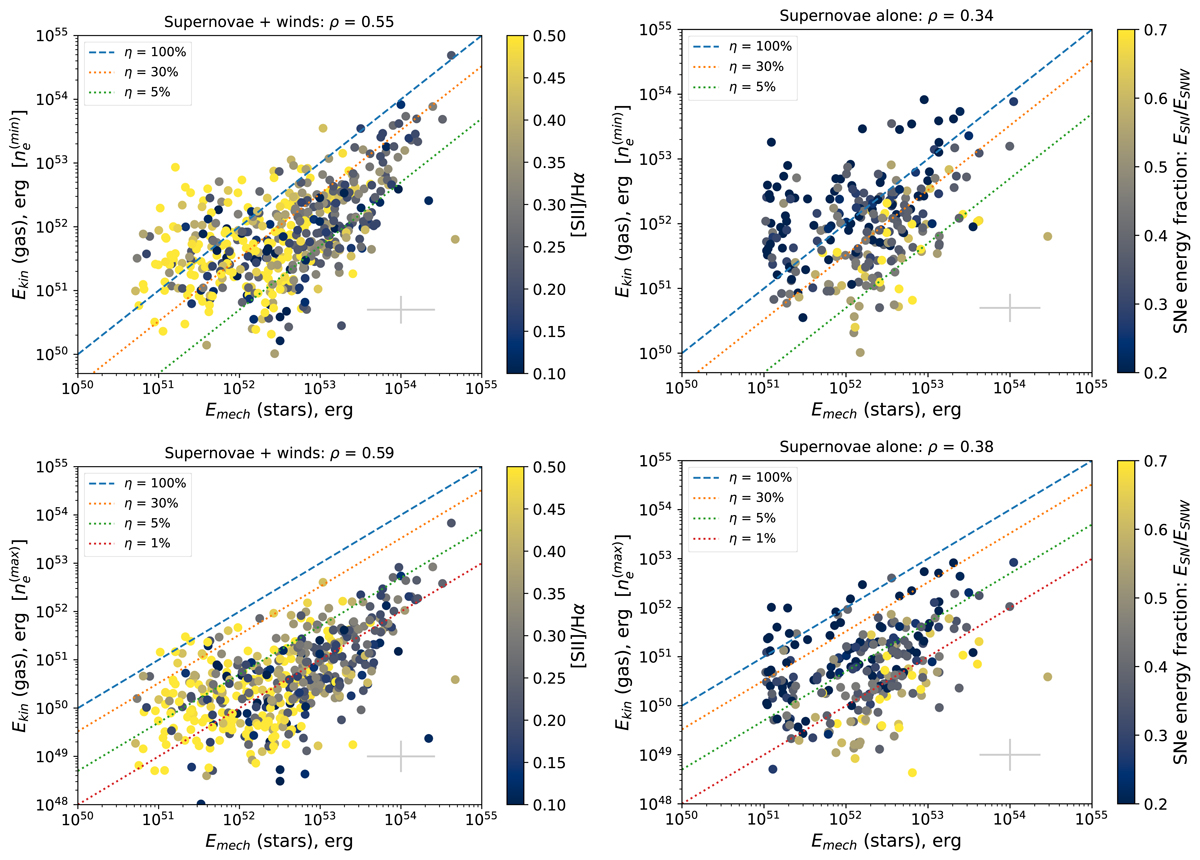
Dependence of the kinetic energy of ionised gas Ekin in the regions of locally elevated velocity dispersion on the total mechanical energy input from the stellar associations in the form of supernovae and stellar winds (left panels), and supernovae alone (right panels). Top and bottom panels correspond to the ![]() and
and ![]() density measurements (thus representing upper and lower limits of Ekin, respectively). Median value of logarithmic errors is shown in bottom-right corner of each panel. All regions with errors 2 times larger than presented are excluded from the plots. Colour encodes the [S II]/Hα lines ratio tracing the dominant gas excitation mechanism ([S II]/Hα > 0.4 is likely produced by shocks; left panels), or the relative contribution of the SNe to the total mechanical energy input according to the STARBURST99 models for the corresponding mass and age of each cluster right panels. Blue, orange, green and red lines correspond to mechanical stellar feedback energy efficiency η = 100, 30, 5, 1%, respectively. Spearman correlation coefficient ρ is given above the plots.
density measurements (thus representing upper and lower limits of Ekin, respectively). Median value of logarithmic errors is shown in bottom-right corner of each panel. All regions with errors 2 times larger than presented are excluded from the plots. Colour encodes the [S II]/Hα lines ratio tracing the dominant gas excitation mechanism ([S II]/Hα > 0.4 is likely produced by shocks; left panels), or the relative contribution of the SNe to the total mechanical energy input according to the STARBURST99 models for the corresponding mass and age of each cluster right panels. Blue, orange, green and red lines correspond to mechanical stellar feedback energy efficiency η = 100, 30, 5, 1%, respectively. Spearman correlation coefficient ρ is given above the plots.
Current usage metrics show cumulative count of Article Views (full-text article views including HTML views, PDF and ePub downloads, according to the available data) and Abstracts Views on Vision4Press platform.
Data correspond to usage on the plateform after 2015. The current usage metrics is available 48-96 hours after online publication and is updated daily on week days.
Initial download of the metrics may take a while.