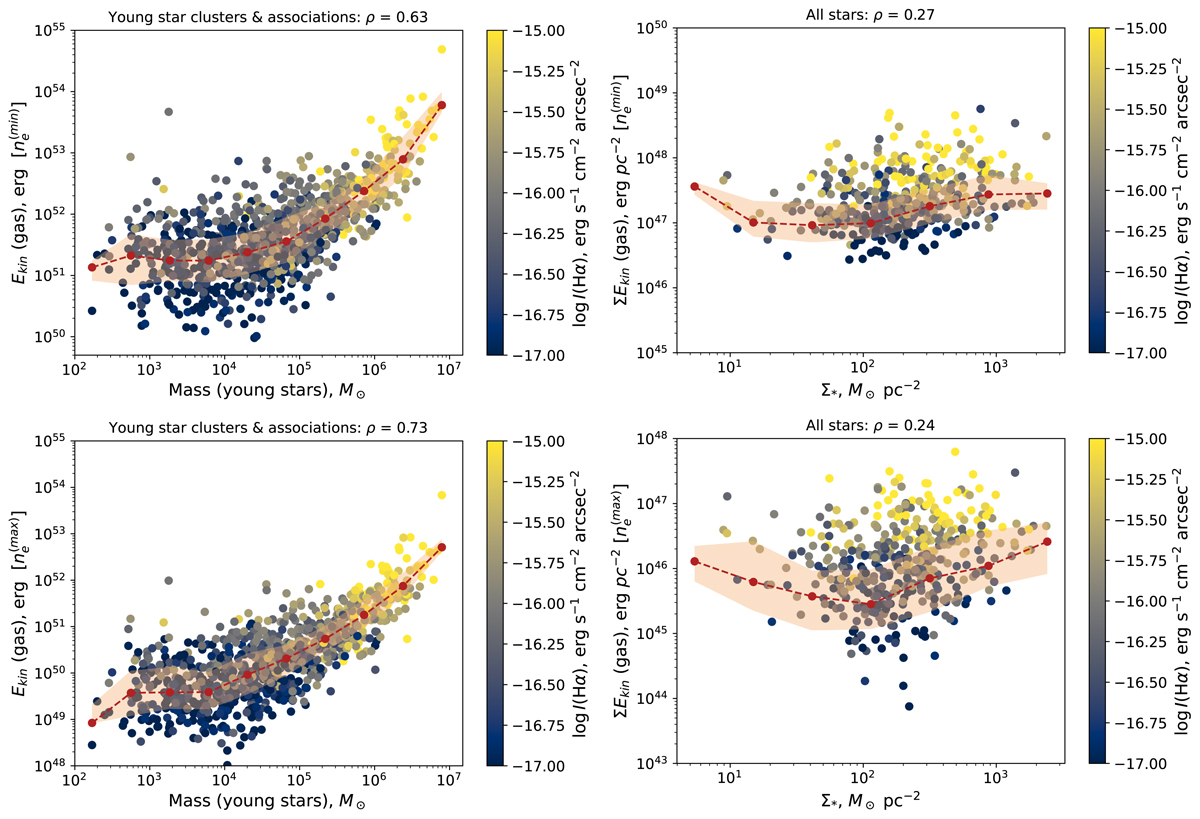
Fig. 15.
Download original image
Dependence of the kinetic energy of ionised gas Ekin in the regions of locally elevated velocity dispersion on the mass of the stellar associations within them (left panels), and their gas kinetic energy per area, ΣEkin, vs. corresponding stellar mass surface density, Σ⋆ (right panels). Top and bottom panels correspond to minimal and maximal values of ne underlying the Ekin measurements. Colour encodes the Hα flux surface brightness. The red line shows the median values of Ekin or ΣEkin in several bins, and the red shaded area corresponds to the 25–75 percentile interval. Spearman correlation coefficients ρ are given above the plots.
Current usage metrics show cumulative count of Article Views (full-text article views including HTML views, PDF and ePub downloads, according to the available data) and Abstracts Views on Vision4Press platform.
Data correspond to usage on the plateform after 2015. The current usage metrics is available 48-96 hours after online publication and is updated daily on week days.
Initial download of the metrics may take a while.