Fig. 14.
Download original image
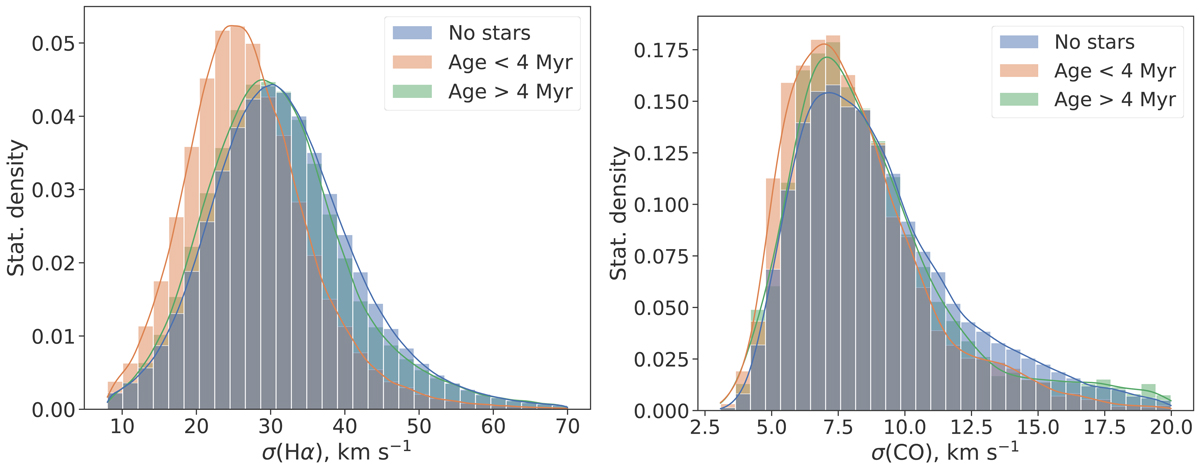
Distribution of the velocity dispersion of Hα (left) and CO (right) emission within the borders of young stellar associations of different ages (orange and blue colours for those younger and older than 4 Myr, respectively) and outside them (green colour). Only pixels with S/N > 30 in the corresponding emission line are considered. Note that increasing the S/N limit does not affect the result.
Current usage metrics show cumulative count of Article Views (full-text article views including HTML views, PDF and ePub downloads, according to the available data) and Abstracts Views on Vision4Press platform.
Data correspond to usage on the plateform after 2015. The current usage metrics is available 48-96 hours after online publication and is updated daily on week days.
Initial download of the metrics may take a while.