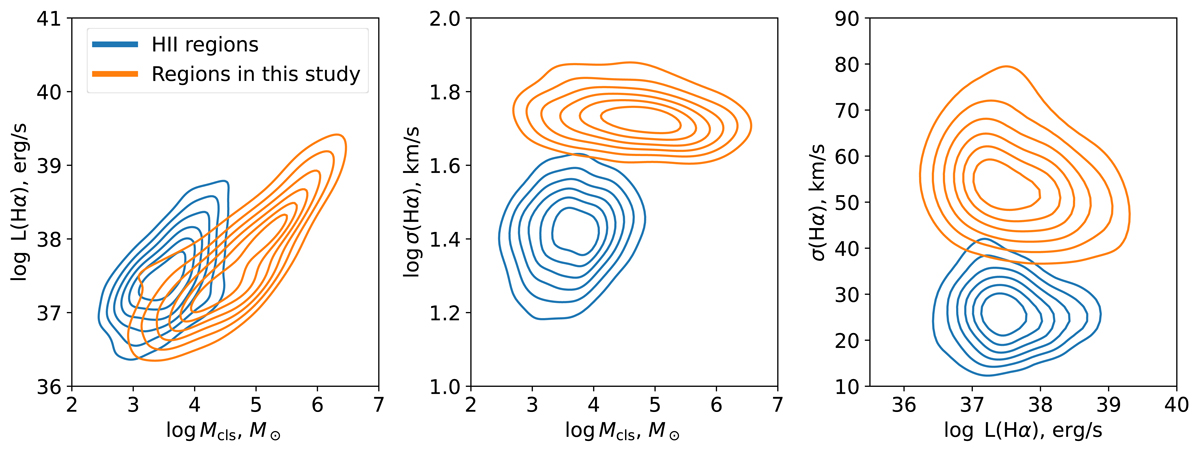
Fig. 13.
Download original image
Properties of the regions of elevated velocity dispersion in comparison to those of normal H II regions. Blue and orange contours show the statistical density distribution of the H II regions (associated with a single star cluster, from the catalogue compiled by Scheuermann et al. 2023) and the regions with locally elevated σ(Hα), respectively. The Hα luminosity (L(Hα)) correlates with the total mass of the clusters (Mcls) for both samples (left panel), but the slope is different implying differences in the escape fraction of the ionising photons and/or contribution of the additional ionising sources. σ(Hα) for the regions in this study slightly decreases with the Mcls (middle panel) and L(Hα) (right panel) contrary to what is observed in the reference H II regions.
Current usage metrics show cumulative count of Article Views (full-text article views including HTML views, PDF and ePub downloads, according to the available data) and Abstracts Views on Vision4Press platform.
Data correspond to usage on the plateform after 2015. The current usage metrics is available 48-96 hours after online publication and is updated daily on week days.
Initial download of the metrics may take a while.